Monitor Smart Sizing Recommendations for Application Resources
Smart Sizing involves adjusting resource requests and limits to ensure your applications have the optimal amount of resources to operate efficiently. This prevents over-provisioning, which can increase costs unnecessarily, and under-provisioning, which may cause performance problems.
The management console provides a separate tab for tracking the Smart Sizing recommendations for your applications.
Monitor Smart Sizing Overview
To monitor the Smart Sizing recommendations on the Overview:
-
Go to Smart Sizing on the left sidebar.
-
On the Smart Sizing page, use the drop-down lists to select a cluster on which your application is smart sized. You can only view recommendations for all namespaces' and microservices of your application.
-
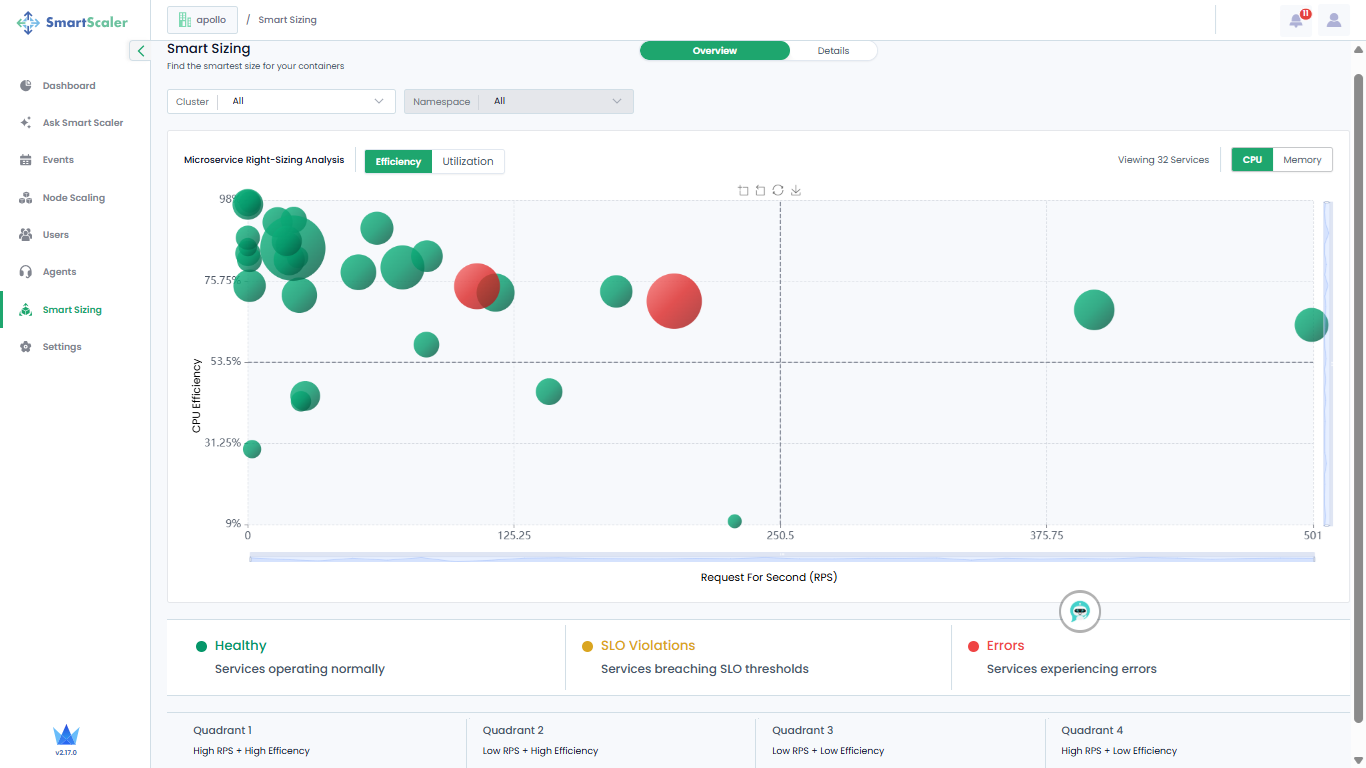
By default, you view CPU Efficiency versus Request per Second recommendations.
-
The visualization is a bubble graph chart where each bubble represents an individual microservice. The color of the bubble indicates the health status of the microservice it represents. The different health statuses are:
- A green bubble is an indication that the microservice is healthy.
- A yellow bubble is an indication that the microservice breached SLO thresholds.
- A red bubble is an indication that the microservices contains errors.
-
Do a mouse hover on each bubble to see more details of the microservice.
-
The microservices are categorized into four quadrants, which indicate:
- Quadrant 1: High RPS + High Efficiency
- Quadrant 2: Low RPS + High Efficiency
- Quadrant 3: Low RPS + Low Efficiency
- Quadrant 4: High RPS + Low Efficiency
-
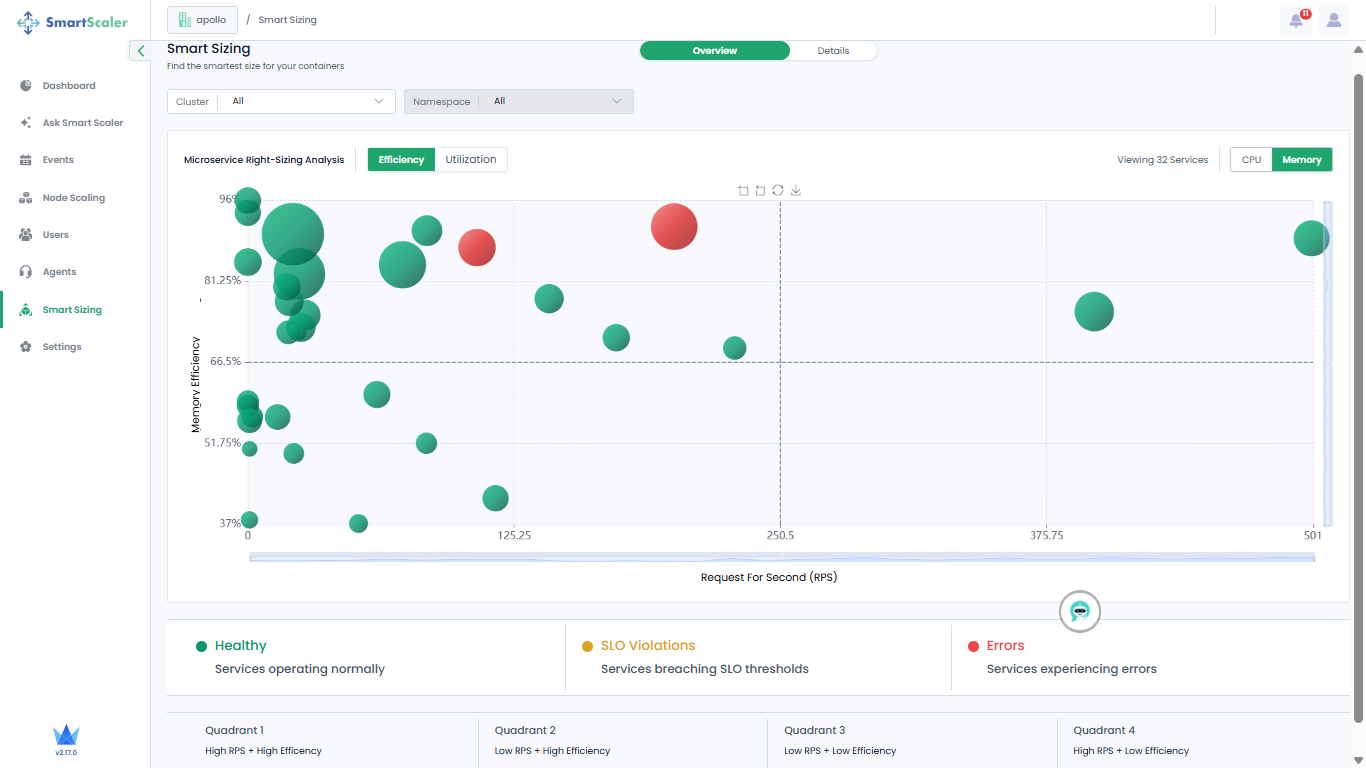
On the top-right, go to Memory to view Memory Efficiency versus Request per Second recommendations.
-
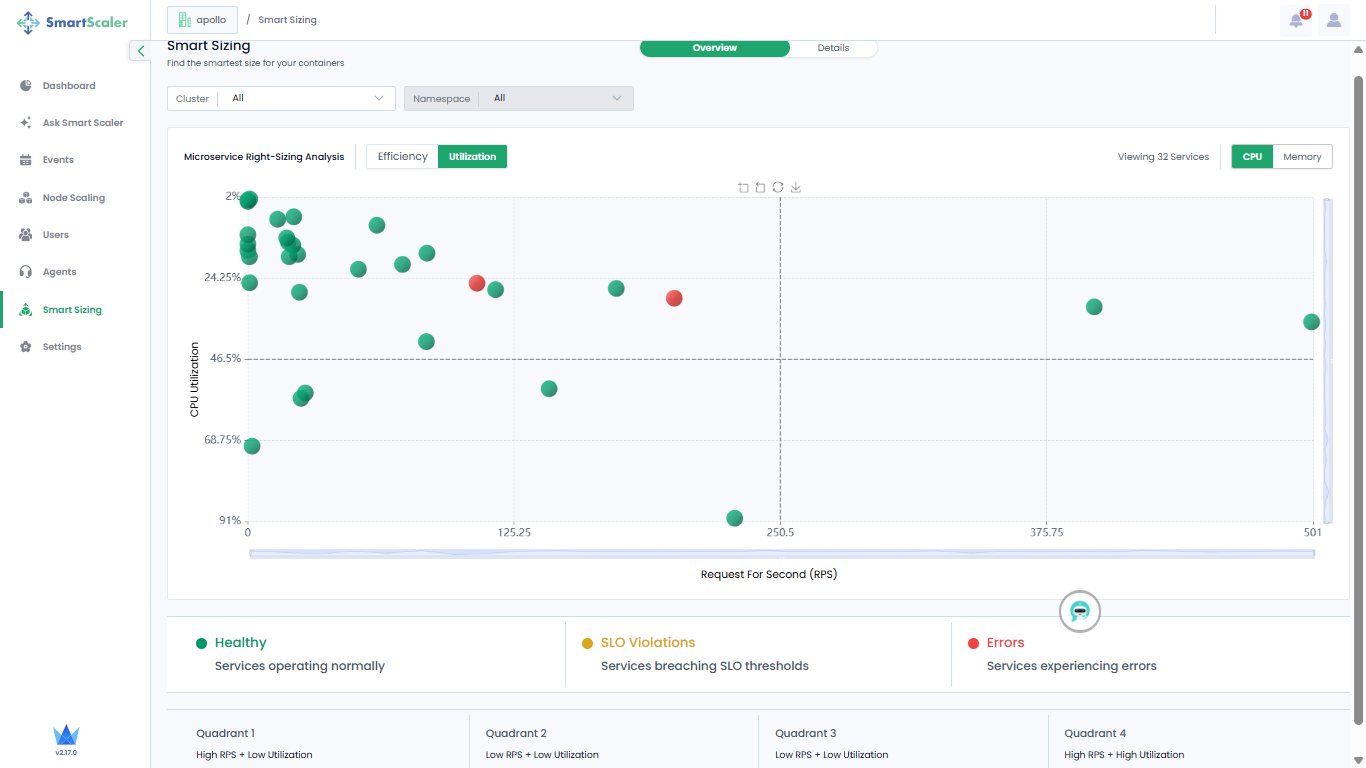
Next to Efficiency, go to Utilization to see the recommendations for CPU utilization.
-
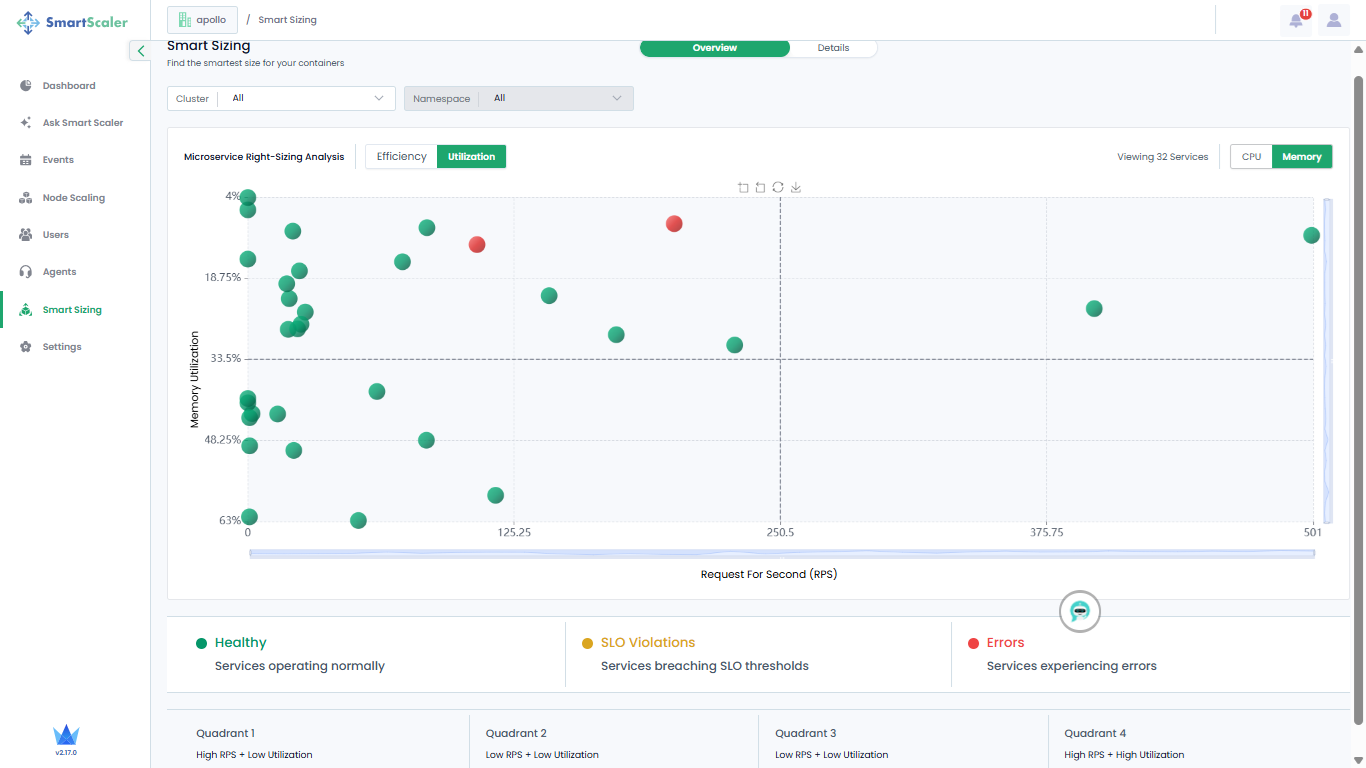
On the top-right corner of the page, go to Memory to see the recommendations for memory utilization.
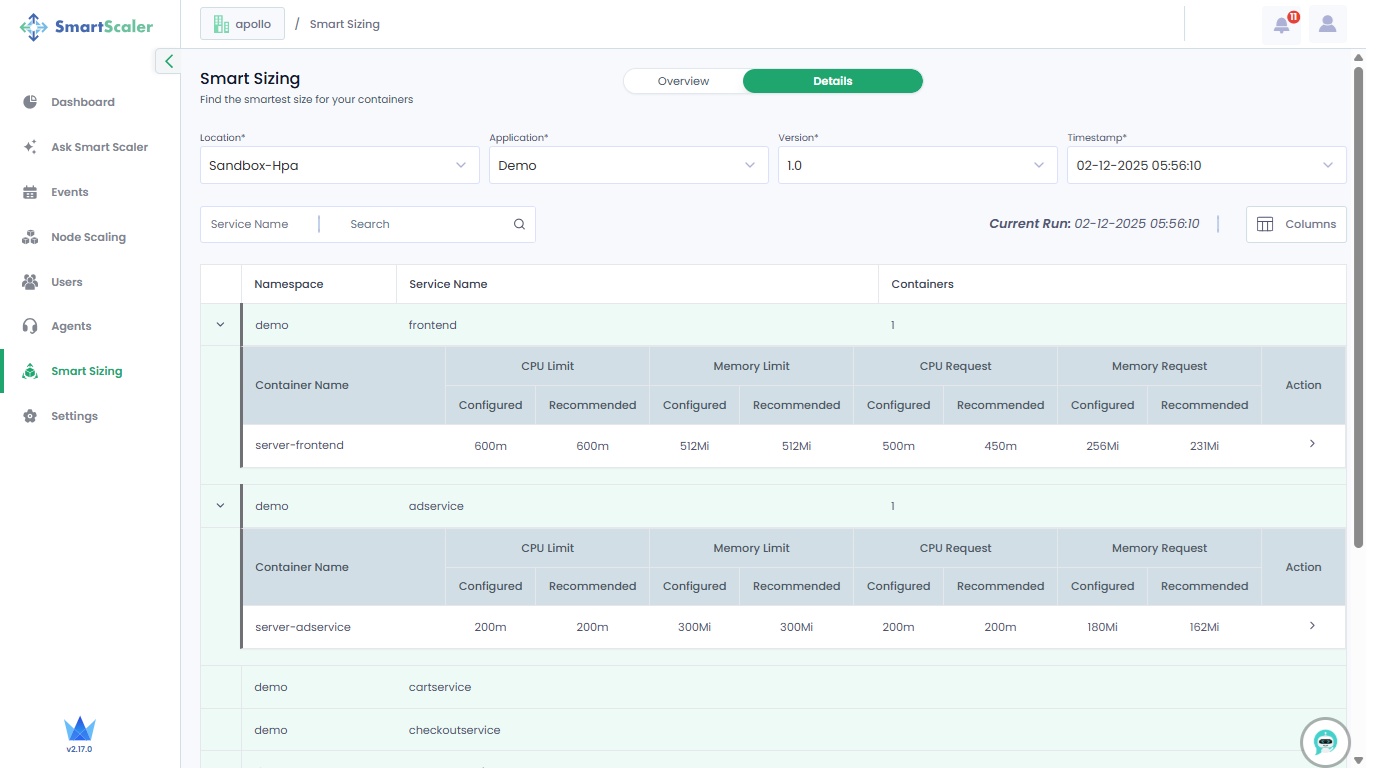
Monitor Details of Smart Sizing Recommendations
To find the smartest size for your containers:
-
On the top of the page, next to Overview, go to Details.
-
Use the drop-down lists to select a cluster, application, and version, and the timestamp at which your application is smart sized.
-
Expand a micro service to see its details.
-
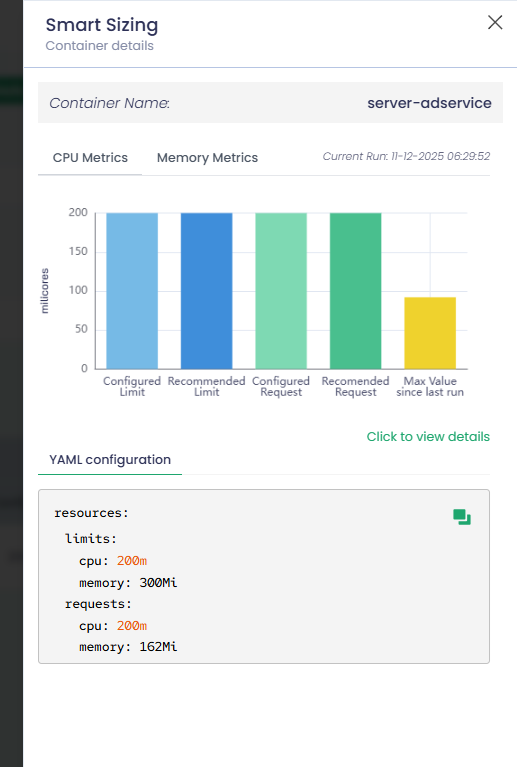
Click on the details to see the container details.
-
(Optional) To know more details, click the hyperlink, Click to view details, which redirects you to the Smart Sizing Details on the dashboard.