Monitor Node Scaling
This topic describes how to monitor the nodes that can be scaled in your workloads.
To monitor nodes for scaling:
-
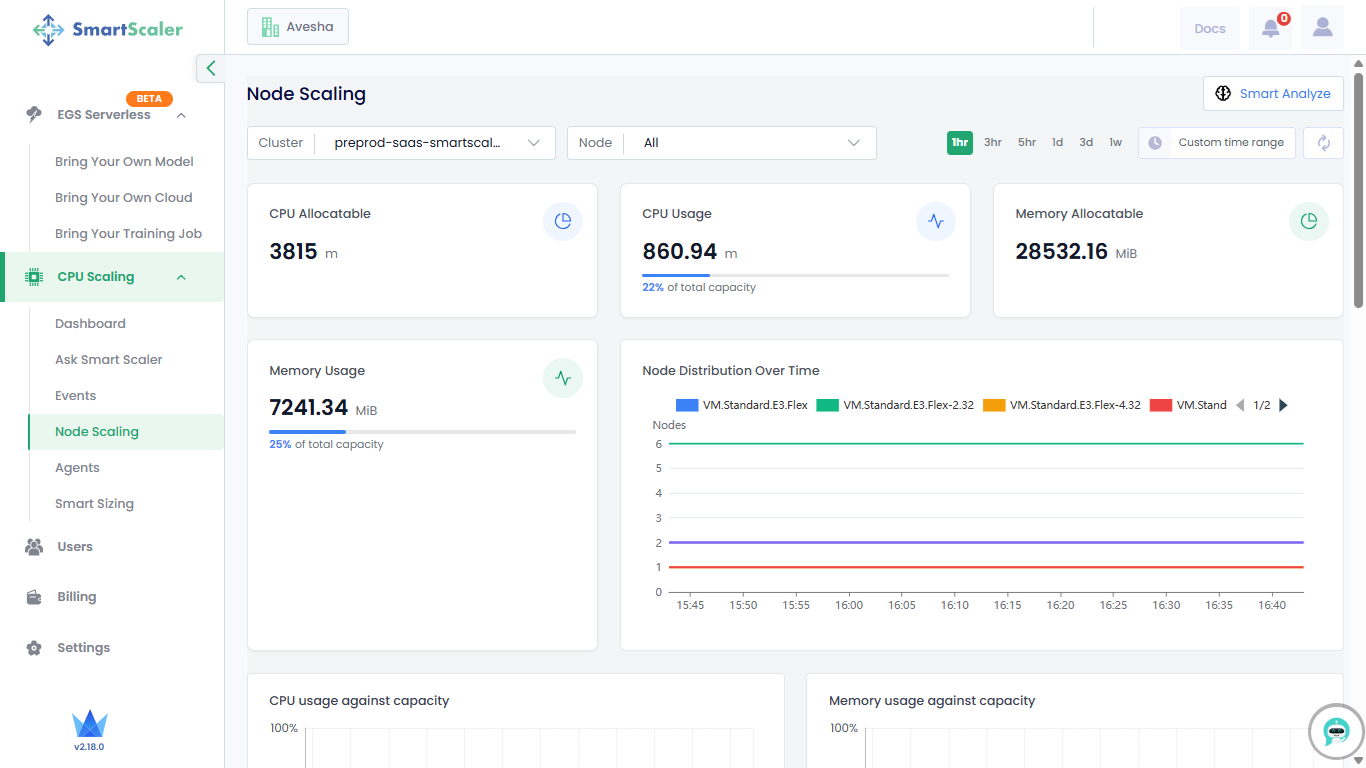
Go to CPU Scaling on the left sidebar and click Node Scaling from the menu.
-
Select your cluster from the Cluster drop-down list.
-
By default, you get the node resource details for the last 1 hour. You can choose the time range options available on that page or customize it.
-
Track resource usage, allocatable resources, and node distribution over time at the top of the page. The Node Distribution Over Time graph shows the distribution of different node types over time. To view all node types, click the 1/2 navigation control next to the node type list.
-
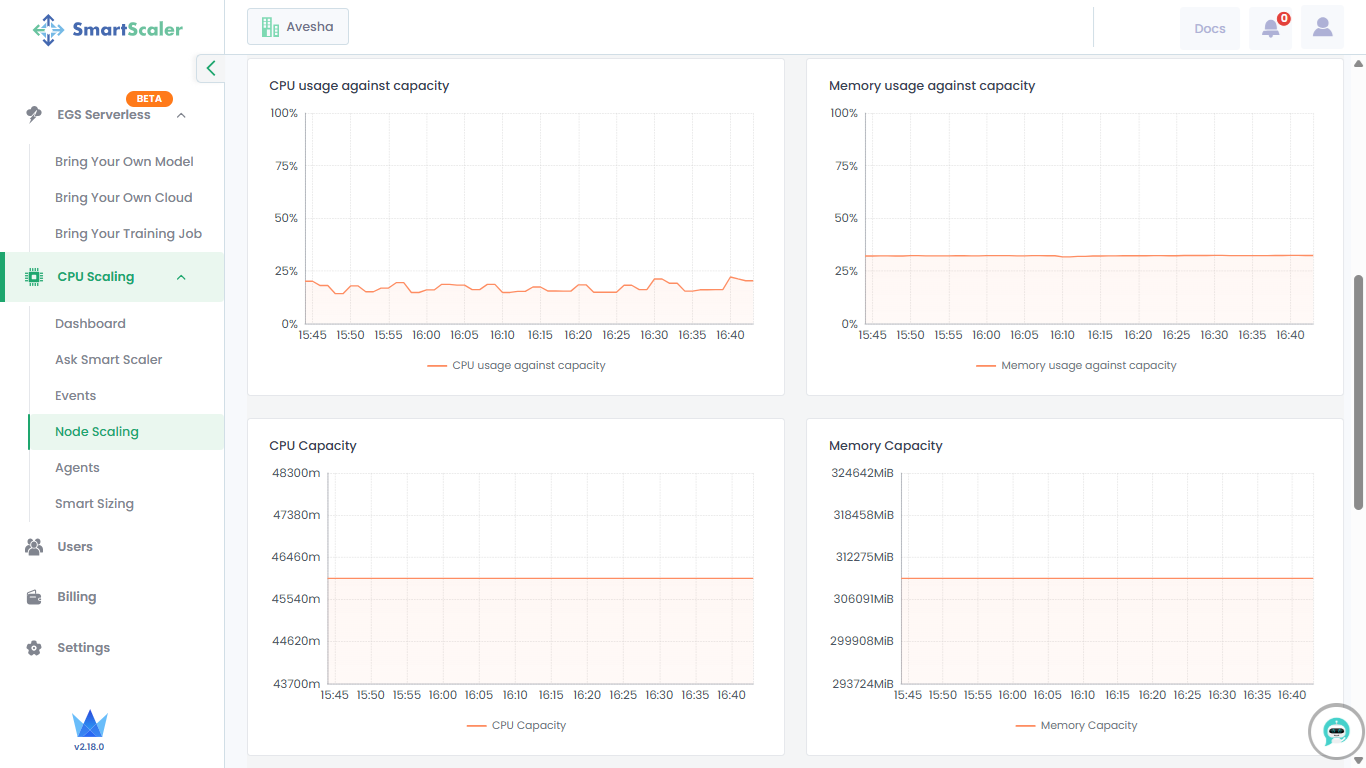
Scroll down to visualize the graphical representation of resource usage against capacity, along with overall resource capacity.
-
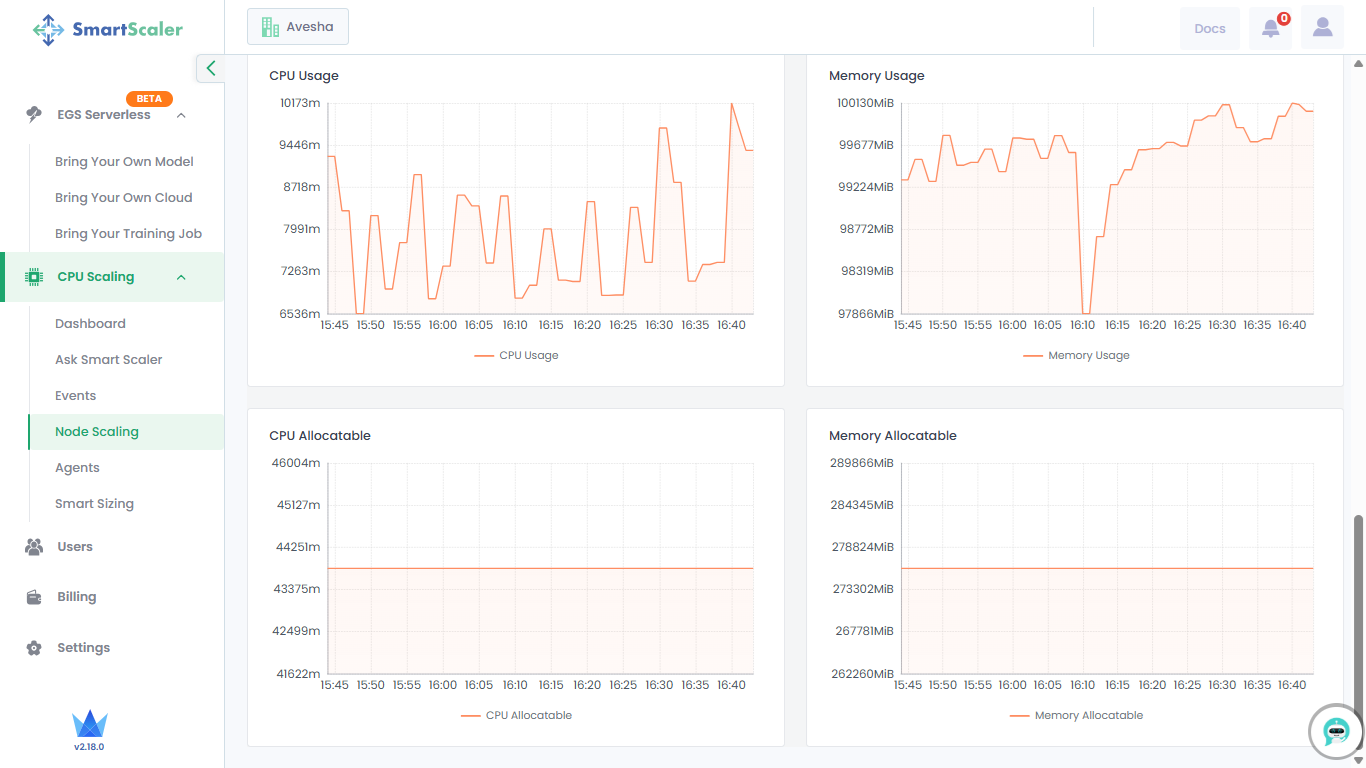
Scroll down further to visualize the graphical representation of resource usage and allocatable resources.