Dashboard
This topic describes the KubeSlice Manager dashboard.
Deployment Map
Go to Dashboard on the left sidebar.
By default, you can see the geographical location of the clusters under Deployment Map.

For clusters, ALL regions are shown by default. You can narrow down to NORTH AMERICA or EUROPE regions.
Cloud clusters are represented by a cloud icon. Edge clusters are represented by a square icon. Data center clusters are represented by a triangle icon. The icons also show the number of nodes on the clusters. Do a mouse hover over each icon to see the cloud-specific regions.
Events
KubeSlice generates events that represents an operation that occurs on the controller and the worker clusters. All of these generated events are specific to KubeSlice operations.
The events are listed on a page that is accessible by clicking the bell icon on the top-right corner of all the KubeSlice Manager tabs.
To see the notification events:
Go to Dashboard or any other tab on the left sidebar.
On the dashboard (or any other feature) page, click the bell icon that is on the top-right corner of the page.

On the Notifications page, under Events, the following event details are available as separate tabular columns:
- EVENT
- NAME
- MESSAGE
- CREATED AT
- EVENTS
- LABELS
- SOURCE
On the Notifications page, under Events, you can:
- Search a keyword in the search box.
- Filter for Warning or Normal severity.
- Filter for events of a slice.
- Filter for events of a worker cluster.
- Filter for events of a namespace.
- Filter for kind of events.
Click the arrow icon at the end of a specific event to see additional details of that event.

For more details on the events, see:
Metrics Information
Go to the Metrics tab to get the topology view of the controller and worker clusters.

On the Metrics tab, click the Chart View button at the right corner to switch the view.

Cluster Details
Go to the Clusters tab to see the cluster details.
You can find the cluster details, capacity, the corresponding cloud name, and the Kubernetes dashboard for the worker clusters that are registered with the KubeSlice Controller.

Kubernetes Dashboard
You can use the Kubernetes dashboard to deploy containerized applications to a Kubernetes cluster, troubleshoot your containerized application, and manage the cluster resources. You can use the Kubernetes dashboard to get an overview of applications running on your cluster and create or modify individual Kubernetes resources (such as deployments, jobs, daemon sets, and so on).
The dashboard also provides information on the state of Kubernetes resources in your cluster and on any errors that may have occurred.
To view the Kubernetes dashboard:
Under KUBERNETES DASHBOARD, click View Dashboard against the worker cluster to go to its Kubernetes dashboard.
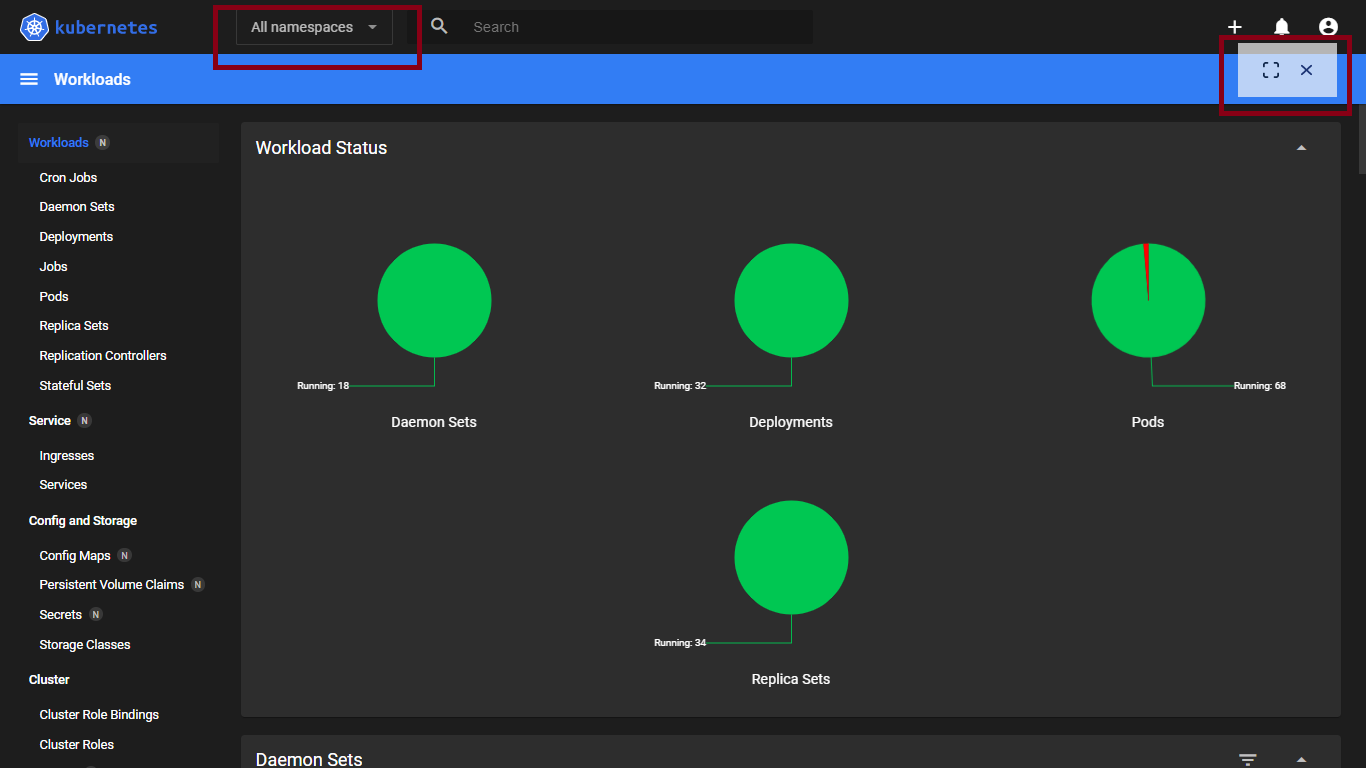
After launching the Kubernetes dashboard, expand the menu that has the default namespace. Select All namespaces or any namespace from the menu list.

Click the full screen button to see the full view of the dashboard. The following figure shows the workloads for all namespaces.
Cluster Health
Go to the Health tab to check the slice and its clusters' health.

The slice health and all its connected worker clusters' health details are available as pie charts with equally-distributed segment representing a component.
:::info The slice and cluster health is auto refreshed every 2.5 minutes. Sometimes, a component would indicate that it has gone down when you hover on the distribution. However, it is due to 2.5-minutes auto-refresh time. Doing a manual refresh will remove that issue. :::
From the Slice drop-down list at the top-right of the dashboard, you can select any other slice to check its health.
The following components affect the slice health:
The following components affect the cluster health:
On the slice health pie chart, hover over the distribution to check a component's health in all the worker clusters. When all the components are in a healthy state, the corresponding pie chart indicates that the health is Normal. When a component's health goes bad, the corresponding pie chart indicates the health with a Warning.
To know how to trace an issue in each component, see slice and cluster health issues.
Resource Quotas
Go to the Resource Quota tab to track the quotas set for pod count, CPU, memory, and ephemeral storage of namespaces onboarded onto a slice.

You can further track the namespace quotas for a specific worker cluster or a namespace by using the corresponding drop-down lists.
info
We also support monitoring the usage and violation by getting the metrics from the KubeSlice Controller's Prometheus service.
Node Utilization
Go to the Nodes tab to see the node utilization.

Service-to-Service Communication
Go to the Services tab to see the logical representation of service-to-service traffic flow. You can also select the time period or a custom duration to see the traffic visualization.
info
This connectivity graph displays workload connectivity only when the workload is deployed with Istio.
