Dashboard
This topic describes the KubeTally dashboard to track the cost of all the resources on all your slices. Dashboard is the landing page that you can view when you log in to KubeTally.
To track the dashboard, go to Dashboard on the left sidebar.
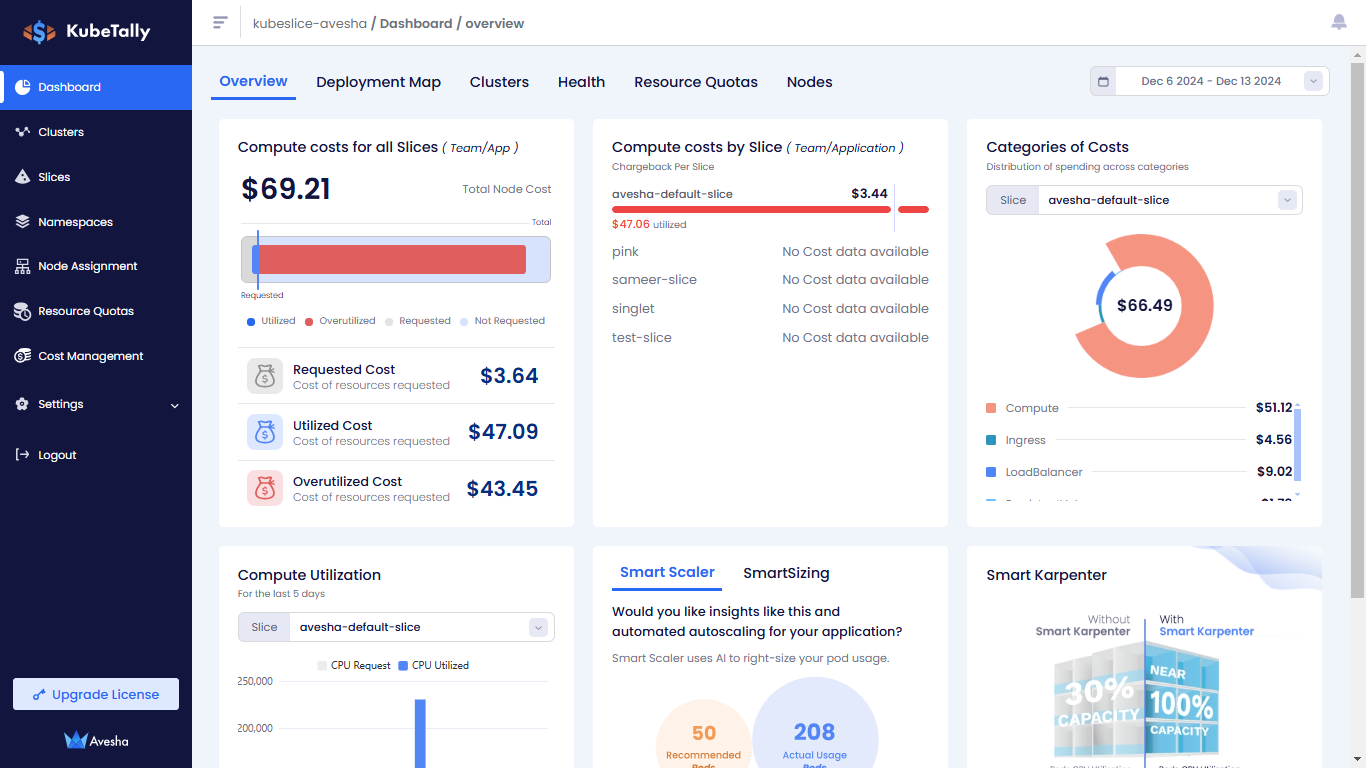
Overview
The dashboard Overview provides the following details:
- Compute Costs for all Slices: Calculate aggregate compute costs across all slices
- Compute Costs by Slice: Break down compute costs for each individual slice
- Categories of Costs: Categories of cost such as compute, ingress, and LoadBalancer
- Compute Utilization: Track CPU utilization metrics
- Smart Scaler/SmartSizing: Smart Scaler/ Smart Sizing information and link to upgrade to Smart Scaler
- Smart Karpenter: Smart Karpenter information and link to register for Smart Karpenter
The last two tiles at the bottom of the dashboard recommends you to:
-
Upgrade to Smart Scaler
Smart Scaler is the world's first Gen AI-based, predictive and fully-automated autoscaler for Kubernetes workloads. It is the only application aware autoscaler that optimizes for business logic outcomes. Smart Scaler has been shown to achieve up to 70% savings over HPA scaling and greatly improves DevOps productivity. For more information, see the Smart Scaler documentation.
-
Register for Smart Karpenter
We bring predictive node provisioning to Karpenter using AI-powered Smart Scaler. This node provision augments AWS Karpenter's rapid node provisioning with predictive, application-aware pod scaling, and rightsizing.
Deployment Map
Go to the Deployments Map tab to see the geographical location of the clusters.
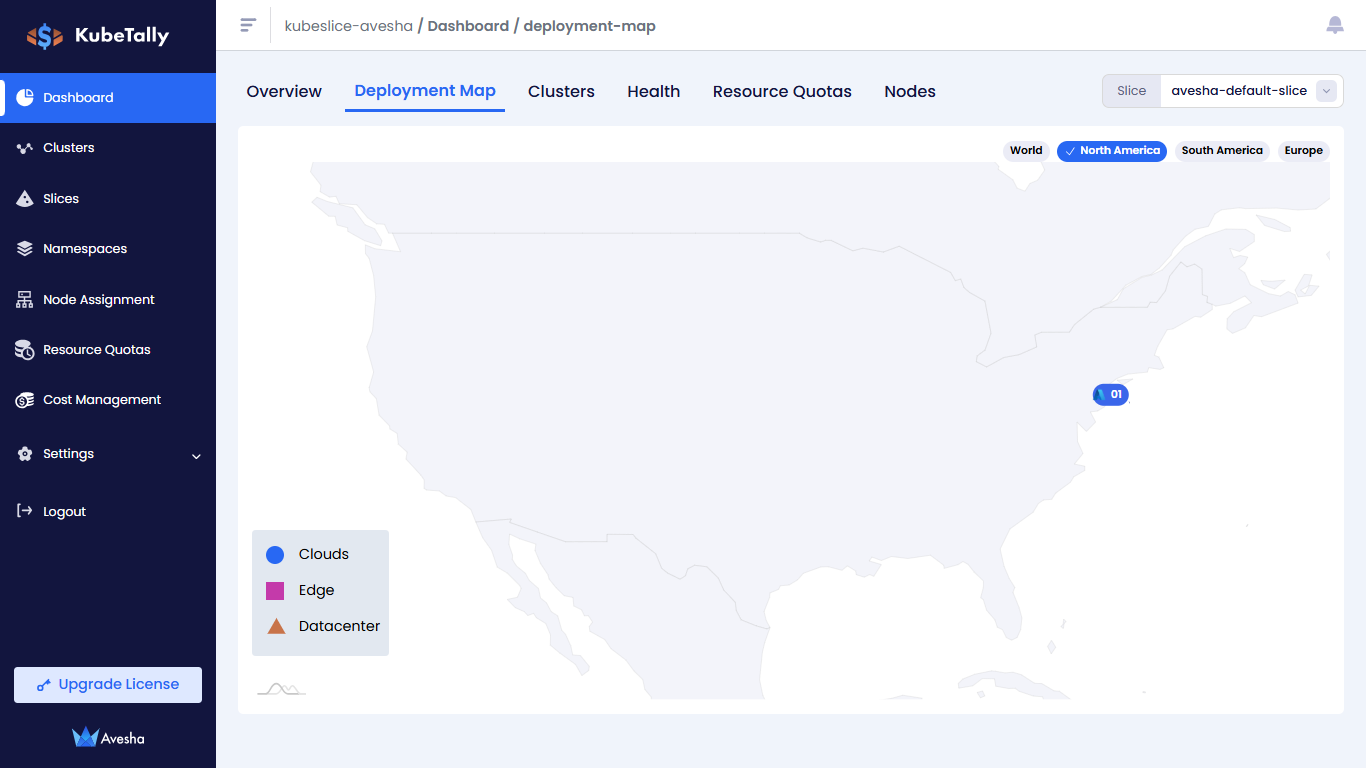
For clusters, all regions are shown by default. You can narrow down to NORTH AMERICA or EUROPE regions.
Cloud clusters are represented by a cloud icon. Edge clusters are represented by a square icon. Data center clusters are represented by a triangle icon. The icons also show the number of nodes on the clusters. Do a mouse hover over each icon to see the cloud-specific regions. Do a mouse hover over data center clusters to view the longitude and latitude coordinates, which help in identifying their geographical locations.
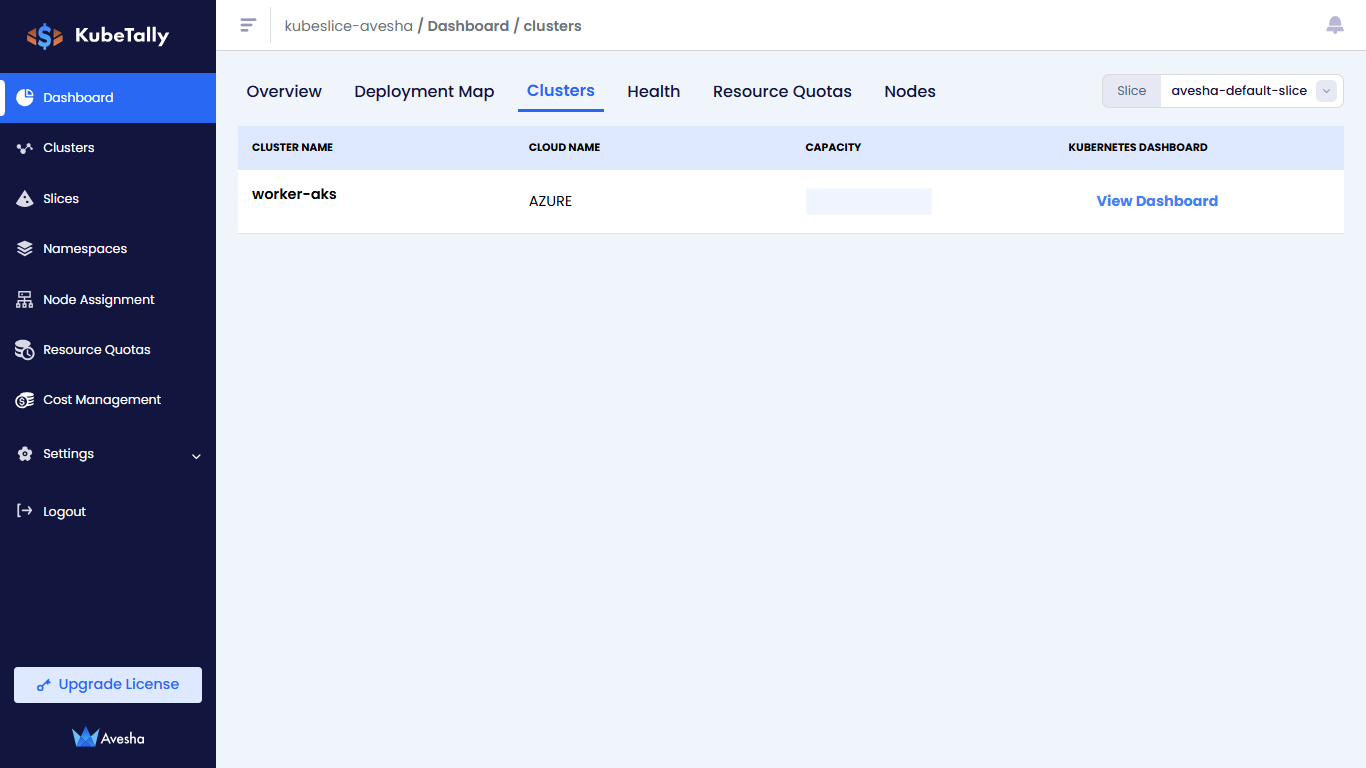
Clusters
Go to the Clusters tab to see the cluster details. You can view details such as cluster name, cloud name, and the Kubernetes dashboard for the worker clusters registered with the KubeSlice Controller.
Health
Go to the Health tab to check the slice and its clusters' health.
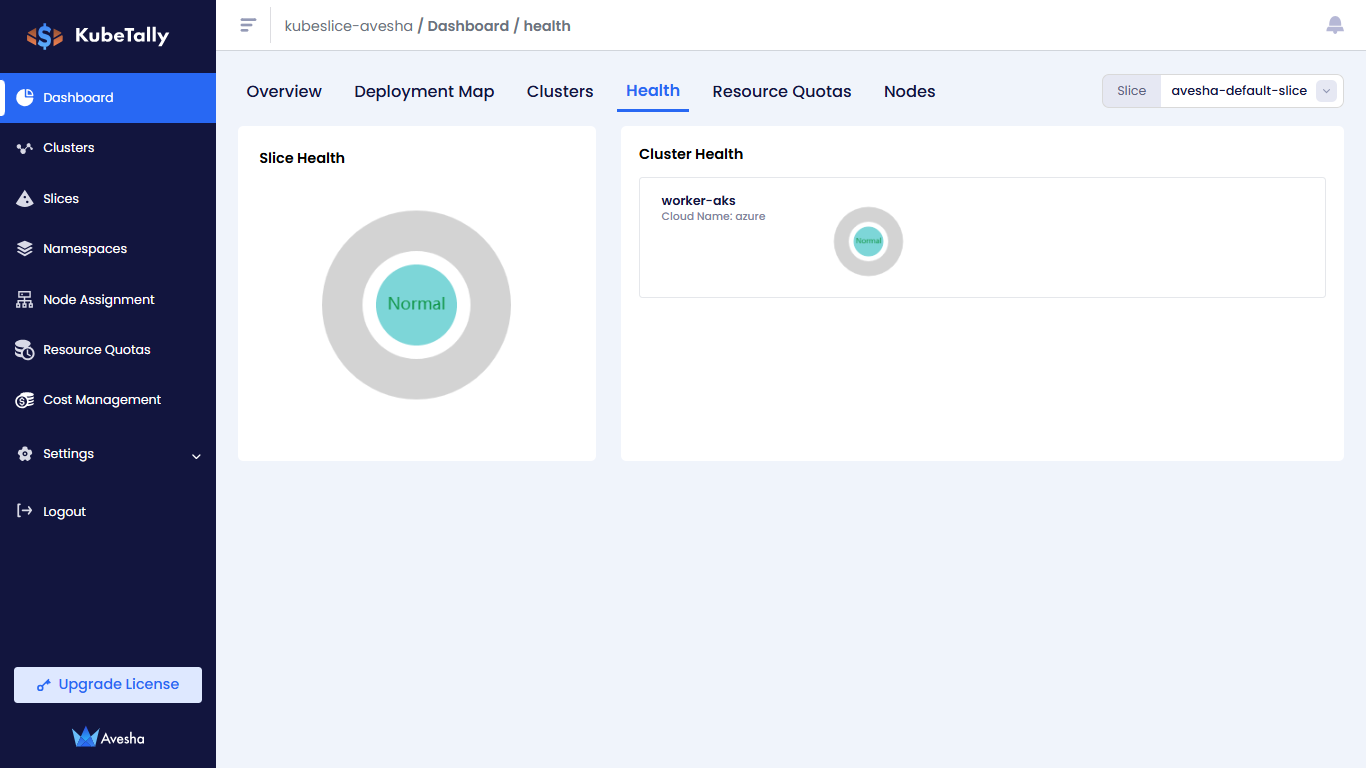
The slice health and all its connected worker clusters' health details are available as pie charts with equally-distributed segment representing a component.
Resource Quotas
Go to the Resource Quotas tab to track the quotas set for pod count, CPU, memory, and ephemeral storage of namespaces onboarded onto a slice.
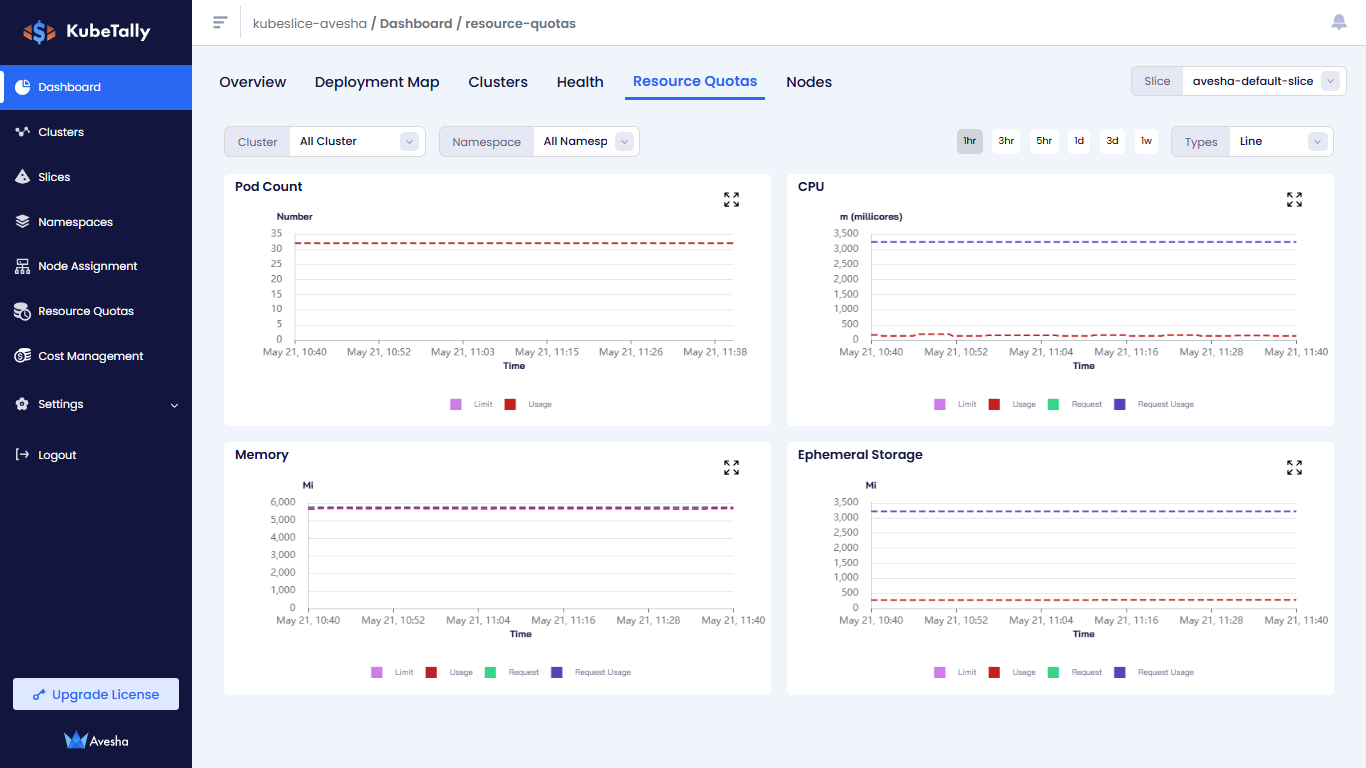
You can further track the namespace quotas for a specific worker cluster or a namespace by using the corresponding drop-down lists.
Nodes
Go to the Nodes tab to see the node utilization.