Install EGS Controller Prerequisites
This topic describes the prerequisites to install Elastic Grid Service (EGS) Controller on a Kubernetes cluster.
EGS requires the following components:
- A monitoring stack for metrics collection (for example, kube-prometheus-stack).
- A Service Monitor to scrape the EGS controller metrics.
- PostgreSQL database to use the KubeTally (Cost Management) features.
Installation Options
You can install the prerequisites using either of the following methods:
- Using the installation script provided in the egs-installation repository.
- Manually install the components using Helm charts.
Install Prometheus and PostgreSQL Using the Script
The egs-installation repository includes the script to install EGS.
You can use the egs-install-prerequisites.sh script to install prerequisites on the controller cluster. Modify the
egs-installer-config.yaml to add the Prometheus and PostgreSQL parameters. To the install the additional applications, always
set the enable_install_additional_apps parameter to true. The script installs and configures all the required components.
The following is an example configuration YAML to install Prometheus and PostgreSQL using the script:
# Enable additional applications installation
enable_install_additional_apps: true

# Enable custom applications
enable_custom_apps: true

# Command execution settings
run_commands: false

# Additional applications configuration
additional_apps:
  - name: "prometheus"
    skip_installation: false
    use_global_kubeconfig: true
    namespace: "egs-monitoring"
    release: "prometheus"
    chart: "kube-prometheus-stack"
    repo_url: "https://prometheus-community.github.io/helm-charts"
    version: "v45.0.0"
    specific_use_local_charts: true
    inline_values:
      prometheus:
        service:
          type: ClusterIP
        prometheusSpec:
          storageSpec: {}
          additionalScrapeConfigs:
          - job_name: tgi
            kubernetes_sd_configs:
            - role: endpoints
            relabel_configs:
            - source_labels: [__meta_kubernetes_pod_name]
              target_label: pod_name
            - source_labels: [__meta_kubernetes_pod_container_name]
              target_label: container_name
          - job_name: gpu-metrics
            scrape_interval: 1s
            metrics_path: /metrics
            scheme: http
            kubernetes_sd_configs:
            - role: endpoints
              namespaces:
                names:
                - egs-gpu-operator
            relabel_configs:
            - source_labels: [__meta_kubernetes_endpoints_name]
              action: drop
              regex: .*-node-feature-discovery-master
            - source_labels: [__meta_kubernetes_pod_node_name]
              action: replace
              target_label: kubernetes_node
      grafana:
        enabled: true
        grafana.ini:
          auth:
            disable_login_form: true
            disable_signout_menu: true
          auth.anonymous:
            enabled: true
            org_role: Viewer
        service:
          type: ClusterIP
        persistence:
          enabled: false
          size: 1Gi
    helm_flags: "--debug"
    verify_install: false
    verify_install_timeout: 600
    skip_on_verify_fail: true
    enable_troubleshoot: false

  - name: "postgresql"
    skip_installation: false
    use_global_kubeconfig: true
    namespace: "kt-postgresql"
    release: "kt-postgresql"
    chart: "postgresql"
    repo_url: "oci://registry-1.docker.io/bitnamicharts/postgresql"
    version: "16.2.1"
    specific_use_local_charts: true
    inline_values:
      auth:
        postgresPassword: "postgres"
        username: "postgres"
        password: "postgres"
        database: "postgres"
      primary:
        persistence:
          enabled: false
          size: 10Gi
    helm_flags: "--wait --debug"
    verify_install: true
    verify_install_timeout: 600
    skip_on_verify_fail: false
Run the installer script, using the following command:
./egs-install-prerequisites.sh --input-yaml egs-installer-config.yaml
The script installs the Prometheus Stack in the egs-monitoring namespace and PostgreSQL in the kt-postgresql namespace.
Install Prometheus Manually
To install Prometheus manually in the existing set-up, follow these steps:
Install Prometheus-Kube-Stack
The kube-prometheus-stack is the recommended monitoring solution as it provides a complete monitoring stack with Prometheus,
Grafana, and AlertManager.
-
Add Helm repository using the following command:
helm repo add prometheus-community https://prometheus-community.github.io/helm-charts
helm repo update -
Install
Kube-Prometheus-Stackwith GPU metrics configuration. Use the following example configuration to create agpu-monitoring-values.yamlfile.# gpu-monitoring-values.yaml
inline_values:
prometheus:
service:
type: ClusterIP # Service type for Prometheus
prometheusSpec:
storageSpec: {} # Placeholder for storage configuration
additionalScrapeConfigs:
- job_name: tgi
kubernetes_sd_configs:
- role: endpoints
relabel_configs:
- source_labels: [__meta_kubernetes_pod_name]
target_label: pod_name
- source_labels: [__meta_kubernetes_pod_container_name]
target_label: container_name
- job_name: gpu-metrics
scrape_interval: 1s
metrics_path: /metrics
scheme: http
kubernetes_sd_configs:
- role: endpoints
namespaces:
names:
- egs-gpu-operator
relabel_configs:
- source_labels: [__meta_kubernetes_endpoints_name]
action: drop
regex: .*-node-feature-discovery-master
- source_labels: [__meta_kubernetes_pod_node_name]
action: replace
target_label: kubernetes_node
grafana:
enabled: true # Enable Grafana
grafana.ini:
auth:
disable_login_form: true
disable_signout_menu: true
auth.anonymous:
enabled: true
org_role: Viewer
service:
type: ClusterIP # Service type for Grafana
persistence:
enabled: false # Disable persistence
size: 1Gi # Default persistence size -
Create a monitoring namespace using the following command:
kubectl create namespace egs-monitoring -
Install the Prometheus stack using the following command:
# Install kube-prometheus-stack with GPU metrics configuration
helm install prometheus prometheus-community/kube-prometheus-stack \
--namespace egs-monitoring \
--values gpu-monitoring-values.yaml \
--set prometheus.prometheusSpec.podMonitorSelectorNilUsesHelmValues=false \
--set prometheus.prometheusSpec.serviceMonitorSelectorNilUsesHelmValues=false
Create Service and Pod Monitors
The EGS Controller exposes metrics on port 18080 and requires proper monitoring configuration to be scraped by Prometheus. To create a Service Monitor and Pod Monitor manually, follow the below steps:
Service Monitor Configuration
You can perform the below installation steps before the EGS Controller installation. The Service Monitor will be active after the installation.
Create a Service Monitor to scrape metrics from the EGS Controller service. Use the following example configuration
to create a servicemonitor.yaml file:
apiVersion: monitoring.coreos.com/v1
kind: ServiceMonitor
metadata:
  name: kubeslice-controller-manager-monitor
  namespace: egs-monitoring  # NAMESPACE: Change this to your monitoring namespace
  labels:
    app.kubernetes.io/instance: kube-prometheus-stack  # PROMETHEUS_INSTANCE: Change to your Prometheus instance
    release: prometheus  # PROMETHEUS_RELEASE: Change to your Prometheus release name
spec:
  endpoints:
    - interval: 30s  # SCRAPE_INTERVAL: How often to collect metrics (30s, 15s, 60s, etc.)
      port: metrics  # Port name where metrics are exposed (port 18080)
      path: /metrics  # METRICS_PATH: Path where metrics are exposed (default: /metrics)
      scrapeTimeout: 10s  # SCRAPE_TIMEOUT: Maximum time to wait for metrics response
      scheme: http  # SCHEME: Use http for port 18080
  namespaceSelector:
    matchNames:
      - kubeslice-controller  # KUBESLICE_CONTROLLER_NAMESPACE: Namespace where controller is deployed
  selector:
    matchLabels:
      control-plane: controller-manager  # Matches the service selector
Pod Monitor Configuration
Create a Pod Monitor for direct pod metrics collection. Use the following example configuration to create a podmonitor.yaml file:
apiVersion: monitoring.coreos.com/v1
kind: PodMonitor
metadata:
  name: kubeslice-controller-manager-pod-monitor
  namespace: egs-monitoring  # NAMESPACE: Change this to your monitoring namespace
  labels:
    app.kubernetes.io/instance: kube-prometheus-stack  # PROMETHEUS_INSTANCE: Change to your Prometheus instance
    release: prometheus  # PROMETHEUS_RELEASE: Change to your Prometheus release name
spec:
  selector:
    matchLabels:
      control-plane: controller-manager  # Matches the pod labels
  namespaceSelector:
    matchNames:
      - kubeslice-controller  # KUBESLICE_CONTROLLER_NAMESPACE: Namespace where controller is deployed
  podMetricsEndpoints:
    - interval: 30s  # SCRAPE_INTERVAL: How often to collect metrics (30s, 15s, 60s, etc.)
      port: "18080"  # PORT: Direct port number as string (matches prometheus.io/port annotation)
      path: /metrics  # METRICS_PATH: Path where metrics are exposed (default: /metrics)
      scrapeTimeout: 10s  # SCRAPE_TIMEOUT: Maximum time to wait for metrics response
      scheme: http  # SCHEME: Use http for direct pod access
Apply the Configuration
Apply the servicemonitor.yaml file and podmonitor.yaml file using the following command:
kubectl apply -f servicemonitor.yaml
kubectl apply -f podmonitor.yaml
PostgreSQL Database Setup
The EGS Controller uses PostgreSQL for KubeTally functionality, which handles chargeback and metrics storage.
You have two options for PostgreSQL deployment:
- Internal PostgreSQL setup for development and testing purposes.
- External PostgreSQL setup for production environments.
Internal PostgreSQL Deployment
-
Install PostgreSQL using Helm.
-
Add Helm repository using the following command:
helm repo add kubeslice-egs-helm-ent-prod https://kubeslice.aveshalabs.io/repository/kubeslice-egs-helm-ent-prod/
helm repo update -
Create a
kt-postgresqlnamespace using the following command:kubectl create namespace kt-postgresql -
Install PostgreSQL using the following command:
helm install kt-postgresql kubeslice-egs-helm-ent-prod/postgresql \
  --namespace kt-postgresql \
  --set auth.postgresPassword=postgres \
  --set auth.username=postgres \
  --set auth.database=postgres \
  --set primary.persistence.enabled=true \
  --set primary.persistence.size=10Gi
-
-
Create a database credentials secrets using the following commands:
# Get PostgreSQL credentials
export POSTGRES_PASSWORD=$(kubectl get secret --namespace kt-postgresql kt-postgresql -o jsonpath="{.data.postgres-password}" | base64 -d)
export POSTGRES_HOST="kt-postgresql.kt-postgresql.svc.cluster.local"
export POSTGRES_PORT="5432"
export POSTGRES_DB="postgres"

# Create secret for EGS Controller
kubectl create secret generic kubetally-db-credentials \
    --from-literal=postgresAddr=$POSTGRES_HOST \
    --from-literal=postgresPort=$POSTGRES_PORT \
    --from-literal=postgresUser=postgres \
    --from-literal=postgresPassword=$POSTGRES_PASSWORD \
    --from-literal=postgresDB=$POSTGRES_DB \
    --from-literal=postgresSslmode=disable \
    -n kubeslice-controller
External PostgreSQL Deployment
Prerequisites
- PostgreSQL 12+ with SSL support
- Database named kubetally
- User with appropriate permissions
- Network access from the Kubernetes cluster
- Install PostgreSQL using Helm.
-
Install PostgreSQL using Helm.
-
Add Helm repository using the following command:
helm repo add kubeslice-egs-helm-ent-prod https://kubeslice.aveshalabs.io/repository/kubeslice-egs-helm-ent-prod/
helm repo update -
Create a kt-postgresql namespace using the following command:
kubectl create namespace kt-postgresql -
Install PostgreSQL using the following command:
helm install kt-postgresql oci://registry-1.docker.io/bitnamicharts/postgresql
--namespace kt-postgresql
--version 16.2.1
--set auth.postgresPassword=postgres
--set auth.username=postgres
--set auth.database=postgres
--set primary.persistence.enabled=false
--set primary.persistence.size=10Gi
-
-
Create external database secrets using the following command:
kubectl create secret generic kubetally-db-credentials \
--from-literal=postgres-addr=your-external-postgres-host \
--from-literal=postgres-port=5432 \
--from-literal=postgres-user=your-username \
--from-literal=postgres-password=your-password \
--from-literal=postgres-db=your-database-name \
--from-literal=postgres-sslmode=require \
-n kubeslice-controller -
The EGS Controller automatically creates the required database schema when it starts. Ensure the database user has the following permissions:
-- Connect to your PostgreSQL instance
\c <your-database-name>

 -- Grant necessary permissions
 GRANT CREATE ON DATABASE your-database-name TO your_username;
 GRANT ALL PRIVILEGES ON ALL TABLES IN SCHEMA public TO your_username;
 GRANT ALL PRIVILEGES ON ALL SEQUENCES IN SCHEMA public TO your_username;
Verify the Deployment
Verify Prometheus Configuration
Use the following command to check if ServiceMonitor are created:
kubectl get servicemonitor -n egs-monitoring
Example Output
NAME                         AGE
kubeslice-controller-manager-monitor         38m
prometheus-grafana                  40m
prometheus-kube-prometheus-alertmanager       40m
prometheus-kube-prometheus-apiserver         40m
prometheus-kube-prometheus-coredns          40m
prometheus-kube-prometheus-kube-controller-manager  40m
prometheus-kube-prometheus-kube-etcd         40m
prometheus-kube-prometheus-kube-proxy        40m
prometheus-kube-prometheus-kube-scheduler      40m
prometheus-kube-prometheus-kubelet          40m
prometheus-kube-prometheus-operator         40m
prometheus-kube-prometheus-prometheus        40m
prometheus-kube-state-metrics            40m
prometheus-prometheus-node-exporter         40m
Use the following command to check Prometheus targets:
kubectl port-forward svc/prometheus-operated 9090:9090 -n egs-monitoring
For example, Prometheus targets can be accessed at http://localhost:9090/targets.
The following figure shows the Service Monitor for EGS Controller in Prometheus targets:
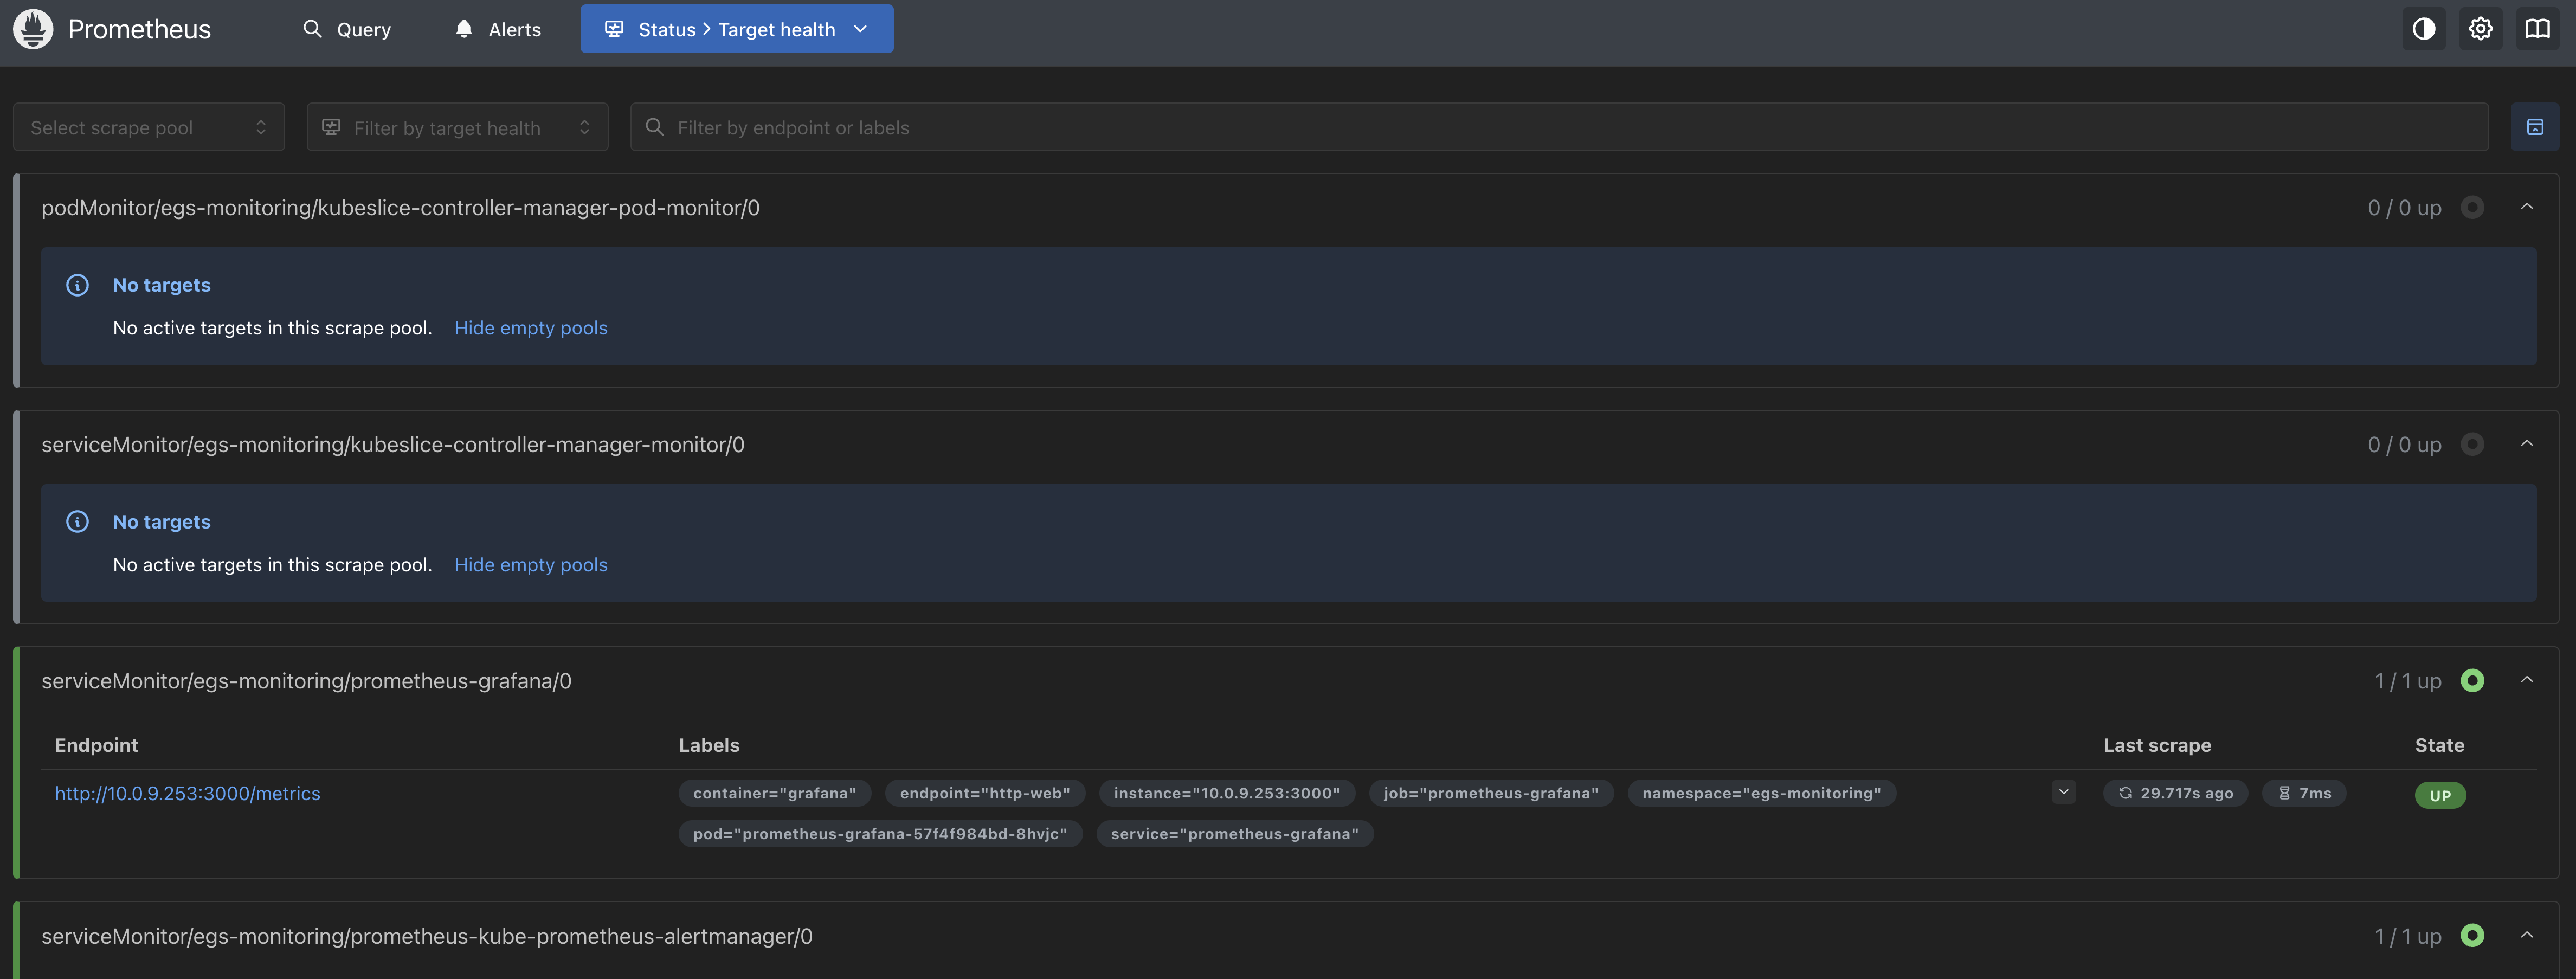
If the EGS Controller is not deployed, the endpoints will not be active. After the EGS Controller installation, the endpoints will be active.
Access the Grafana Dashboard
Grafana can be accessed using port forwarding. Use the following command to access Grafana:
kubectl port-forward svc/prometheus-grafana 3000:80 -n egs-monitoring
For example, Grafana can be accessed at http://localhost:3000.
The default username is admin and the password is prom-operator. You can change the password after the first login.
Verify the PostgreSQL Connection
-
Use the following command to test the internal PostgreSQL connection:
# Test internal PostgreSQL connection
kubectl run postgresql-client --rm --tty -i --restart='Never' \
  --namespace kt-postgresql \
  --image docker.io/bitnami/postgresql:latest \
  --env="PGPASSWORD=$POSTGRES_PASSWORD" \
--command -- psql --host kt-postgresql -U postgres -d postgres -p 5432 -
Use the following command to list databases:
\lExample Output
                        List of databases
Name  | Owner  | Encoding | Locale Provider |  Collate  |  Ctype  | Locale | ICU Rules |  Access privileges
-----------+----------+----------+-----------------+-------------+-------------+--------+-----------+-----------------------
postgres | postgres | UTF8   | libc      | en_US.UTF-8 | en_US.UTF-8 |    |      |
template0 | postgres | UTF8   | libc      | en_US.UTF-8 | en_US.UTF-8 |    |      | =c/postgres     +
   |     |     |         |       |       |    |      | postgres=CTc/postgres
template1 | postgres | UTF8   | libc      | en_US.UTF-8 | en_US.UTF-8 |    |      | =c/postgres     +
   |     |     |         |       |       |    |      | postgres=CTc/postgres
(3 rows) -
Use the following command to test external PostgreSQL connection (if applicable):
# Test external PostgreSQL connection (if applicable)
kubectl run postgresql-client --rm --tty -i --restart='Never' \
  --image docker.io/bitnami/postgresql:latest \
  --env="PGPASSWORD=your_password" \
  --command -- psql --host your-external-host -U your-username -d your-database-name -p 5432