Install Using Helm Charts
This topic describes how to manually install EGS using Helm charts.
- The EGS Controller is also referred to as the KubeSlice Controller in some diagrams and in the YAML files.
- The EGS Admin Portal is also referred to as the KubeSlice Manager (UI) in some diagrams and in the YAML files.
Prerequisites
Before you begin the installation, ensure that you have completed the following prerequisites:
- Have access to the Kubernetes cluster where you will install EGS and have the necessary permissions to create namespaces, deploy applications, and manage resources.
- Installed prerequisites for the EGS controller. For more information, see Install EGS Controller Prerequisites.
- Installed prerequisites for the worker cluster. For more information, see Install EGS Worker Prerequisites.
- Applied a valid EGS license received from Avesha. For more information, see EGS Registration.
- Have the required command-line tools installed, including
kubectlandHelm. For more information, see Install Command Line Tools.
Add and Update the Helm Repository
Use the following command to add and update the Helm repository:
helm repo add kubeslice-egs-helm-ent-prod https://kubeslice.aveshalabs.io/repository/kubeslice-egs-helm-ent-prod/
helm repo update
Create a Namespace
To create a kubeslice-controller namespace on the controller cluster, use the following command:
kubectl create namespace kubeslice-controller
Apply the License Secret File
To apply the license secret file, use the following command:
kubectl apply -f <license-secret-file> -n kubeslice-controller
After the license is applied, it is stored securely in EGS. You can manage the license through CLI. The license secret
is stored in the kubeslice-controller namespace and can be viewed using:
kubectl get secret <license-secret-name.yaml> -n kubeslice-controller -o yaml
Install the EGS Controller
Get the PostgresSQL secret details, Kubernetes controller endpoint, and Prometheus endpoint URL. You will need these details to
configure the values-controller.yaml file.
-
Get the PostgreSQL secret details:
infoThe PostgreSQL secret is created in the
kubeslice-controllernamespace as part of the pre-requisites installation. Use these secrets and not the ones in thekt-postgresqlnamespace. The secret name iskubetally-db-credentials. The values must be base64 decoded.Example
k get secret kubetally-db-credentials -n kubeslice-controller -o json | jq -r '.data | to_entries[] | "\(.key)=\(.value|@base64d)"' -
Get the Kubernetes controller endpoint:
kubectl cluster-infoExample Output
Kubernetes control plane is running at https://pu.mk8scluster-e00w111mv8rn8em35z.mk8s.eu-north1.nebius.cloud:443
CoreDNS is running at https://pu.mk8scluster-e00w111mv8rn8em35z.mk8s.eu-north1.nebius.cloud:443/api/v1/namespaces/kube-system/services/coredns:udp-53/proxy -
Get the Prometheus endpoint URL:
kubectl get svc -n egs-monitoringExample Output
NAME                        TYPE           CLUSTER-IP      EXTERNAL-IP      PORT(S)                      AGE
prometheus-operated        ClusterIP   None            <none>           9090/TCP                     10m
prometheus-kube-prometheus-prometheus   LoadBalancer   10.43.240.123   129.1XX.116.71  443:32000/TCP                 10m
For example, the PrometheusUrl value is "http://prometheus-kube-prometheus-prometheus.egs-monitoring.svc.cluster.local:9090".
-
Create a
values-controller.yamlfile with the following properties:global:
imageRegistry: harbor.saas1.smart-scaler.io/avesha/aveshasystems
# user can configure labels or annotations that EGS Controller namespaces should have
namespaceConfig:
labels: {}
annotations: {}
kubeTally:
enabled: false # need postgress avaialble for true. Set to true if you want to enable KubeTally.
postgresSecretName: POSTGRES_SECRET_NAME
existingSecret: false # Set to true if secret is pre-created externally
postgresAddr: POSTGRES_ADDR
postgresPort: POSTGRES_PORT
postgresUser: POSTGRES_USER
postgresPassword: POSTGRES_PASSWORD
postgresDB: POSTGRES_DB
postgresSslmode: POSTGRES_SSLMODE
prometheusUrl: PROMETHEUS_ENDPOINT # Prometheus endpoint URL
kubeslice:
controller:
endpoint: CONTROLLER_ENDPOINT # Kubernetes control plane endpoint from kubectl cluster-info
# ServiceMonitor configuration for Prometheus monitoring
serviceMonitor:
# Enable or disable ServiceMonitor deployment
enabled: false # Set to true to enable ServiceMonitor deployment. ServiceMonitor is used by Prometheus to scrape metrics from EGS Controller components.
# Namespace where ServiceMonitor will be deployed
namespace: egs-monitoringThe following is an example of the
values-controller.yamlfile:global:
imageRegistry: harbor.saas1.smart-scaler.io/avesha/aveshasystems # Docker registry for the images
imagePullSecrets:
name: "kubeslice-image-pull-secret"
create: true
registry: harbor.saas1.smart-scaler.io ## Harbor registry URL (without https://)
username: ""
password: ""
email: "" # Optional email field
namespaceConfig: # user can configure labels or annotations that EGS Controller namespaces should have
labels: {}
annotations: {}
kubeTally:
enabled: true # Enable KubeTally in the controller
#### Postgresql Connection Configuration for Kubetally ####
existingSecret: false # Set to true if secret is pre-created externally
postgresSecretName: kubetally-db-credentials # Secret name in kubeslice-controller namespace for PostgreSQL credentials created by install, all the below values must be specified
# then a secret will be created with specified name.
# alternatively you can make all below values empty and provide a pre-created secret name with below connection details format
postgresAddr: "kt-postgresql.kt-postgresql.svc.cluster.local" # Change this Address to your postgresql endpoint
postgresPort: 5432 # Change this Port for the PostgreSQL service to your values
postgresUser: "postgres" # Change this PostgreSQL username to your values
postgresPassword: "postgres" # Change this PostgreSQL password to your value
postgresDB: "postgres" # Change this PostgreSQL database name to your value
postgresSslmode: disable # Change this SSL mode for PostgreSQL connection to your value
prometheusUrl: http://prometheus-kube-prometheus-prometheus.egs-monitoring.svc.cluster.local:9090 # Prometheus URL for monitoring
kubeslice:
controller:
endpoint: ""noteIn a multi-cluster deployment, the controller cluster must be able to reach the Prometheus endpoints running on the worker clusters.
warningIf the Prometheus endpoints are not configured, you may experience issues with the dashboards (for example, missing or incomplete metric displays).
-
Use the
values-controller.yamlfile in the following command to install the EGS Controller:helm install egs-controller kubeslice-egs-helm-ent-prod/kubeslice-controller-egs -f <values-controller.yaml> -n kubeslice-controller -
Verify the installation by checking the status of the EGS Controller pods:
kubectl get pods -n kubeslice-controllerExample Output
NAME                                                READY   STATUS      RESTARTS   AGE
egs-gpr-manager-74f64ff8c7-h8dr2                    1/1     Running     0          2m25s
egs-inventory-controller-manager-86b7c49fdf-975bb   1/1     Running     0          2m25s
egs-queue-manager-cfcfb9d85-s8qlb                   1/1     Running     0          2m25s
kubeslice-controller-manager-678985bdd6-75w5t       2/2     Running     0          2m25s
kubetally-pricing-service-b69c65c7-7gq7x            1/1     Running     0          2m25s
kubetally-pricing-updater-job-rdpnf                 1/1     Running     0          2m25s
kubetally-report-7c6fdbcb88-6bvdz                   1/1     Running     0          2m25s
Install the EGS Admin Portal
-
Create a file called
values-ui.yamlwith the following properties:global:
imageRegistry: harbor.saas1.smart-scaler.io/avesha/aveshasystems # Docker registry for the UI images
imagePullSecrets:
# Enable/disable global image pull secrets
enabled: true
# Name of the secret to use globally
name: "kubeslice-ui-image-pull-secret"
# Additional secrets (useful for multi-registry setups)
additional: []
# Example:
# additional:
# - name: "additional-registry-secret"
# - name: "another-registry-secret"
# Secret creation configuration (leave empty if secrets are managed externally)
registry: harbor.saas1.smart-scaler.io ## Harbor registry URL (without https://)
username: ""
password: ""
email: "" # Optional email field
dockerconfigjson: ## Value to be used if using external secret managers (leave empty to use repository/username/password)
kubeslice:
prometheus:
url: http://prometheus-kube-prometheus-prometheus.egs-monitoring.svc.cluster.local:9090 # Prometheus URL for monitoring
uiproxy:
service:
type: LoadBalancer # Service type for the UI proxy
## if type selected to NodePort then set nodePort value if required
# nodePort:
# port: 443
# targetPort: 8443
labels:
app: kubeslice-ui-proxy
annotations: {}
ingress:
## If true, ui‑proxy Ingress will be created
enabled: false
## Port on the Service to route to
servicePort: 443
## Ingress class name (e.g. "nginx"), if you're using a custom ingress controller
className: ""
hosts:
- host: ui.kubeslice.com # replace with your FQDN
paths:
- path: / # base path
pathType: Prefix # Prefix | Exact
## TLS configuration (you must create these Secrets ahead of time)
tls: []
# - hosts:
# - ui.kubeslice.com
# secretName: uitlssecret
annotations: {}
## Extra labels to add onto the Ingress object
extraLabels: {}
apigw:
env:
- name: DCGM_METRIC_JOB_VALUE
value: nvidia-dcgm-exporter
egsCoreApis:
enabled: true # Enable EGS core APIs for the UI
service:
type: ClusterIP # Service type for the EGS core APIs -
Use the
values-ui.yamlin the following command to install the EGS Admin Portal:helm install egs-ui kubeslice-egs-helm-ent-prod/kubeslice-ui-egs -f <values-ui.yaml> -n kubeslice-controller
Create a Project
-
Create a file called
project.yamlwith the following properties:apiVersion: controller.kubeslice.io/v1alpha1
kind: Project
metadata:
name: avesha
namespace: kubeslice-controller
spec:
serviceAccount:
readWrite:
- admin -
Apply the
project.yamlfile by using it in the following command in the controller cluster:kubectl apply -f project.yaml -n kubeslice-controller
Log in to the Admin Portal
To access the EGS Admin Portal, you need to retrieve the Admin Portal URL and the admin access token.
-
Get the Admin Portal URL, use the following command:
# Check EGS UI pod status
kubectl get pods -n kubeslice-controller | grep kubeslice-ui-proxy
Ensure that the
kubeslice-ui-proxypod is in theRunningstate before proceeding.Depending on the service type configured in the
values-ui.yamlfile, use one of the following methods to get the Admin Portal URL:-
For LoadBalancer service type:
kubectl get svc kubeslice-ui-proxy -n kubeslice-controller -o jsonpath='{.status.loadBalancer.ingress[0].hostname}' 2>/dev/null || \
kubectl get svc kubeslice-ui-proxy -n kubeslice-controller -o jsonpath='{.status.loadBalancer.ingress[0].ip}' 2>/dev/null
Example
kubectl get svc kubeslice-ui-proxy -n kubeslice-controllerExample Output
NAME                 TYPE           CLUSTER-IP       EXTERNAL-IP       PORT(S)         AGE
kubeslice-ui-proxy   LoadBalancer   10.128.144.231   139.144.167.243   443:32185/TCP   9m23s
Example
kubectl get svc kubeslice-ui-proxy -n kubeslice-controller -o jsonpath='{.status.loadBalancer.ingress[0].hostname}' 2>/dev/null || \
kubectl get svc kubeslice-ui-proxy -n kubeslice-controller -o jsonpath='{.status.loadBalancer.ingress[0].ip}' 2>/dev/null
Example Output
139-144-167-243.ip.linodeusercontent.com -
For NodePort service type:
NODE_IP=$(kubectl get nodes -o jsonpath='{.items[0].status.addresses[?(@.type=="ExternalIP")].address}' 2>/dev/null | grep -Eo '([0-9]{1,3}\.){3}[0-9]{1,3}' | head -n1)
if [ -z "$NODE_IP" ]; then
NODE_IP=$(kubectl get nodes -o jsonpath='{.items[0].status.addresses[?(@.type=="InternalIP")].address}' 2>/dev/null | grep -Eo '([0-9]{1,3}\.){3}[0-9]{1,3}' | head -n1)
fi
NODE_PORT=$(kubectl get svc kubeslice-  ui-proxy -n kubeslice-controller -o jsonpath='{.spec.ports[0].nodePort}' 2>/dev/null)
echo "https://$NODE_IP:$NODE_PORT"
Example Output
NODE_IP=$(kubectl get nodes -o jsonpath='{.items[0].status.addresses[?(@.type=="ExternalIP")].address}' 2>/dev/null | grep -Eo '([0-9]{1,3}\.){3}[0-9]{1,3}' | head -n1)
echo $NODE_IP
139.177.207.126

if [ -z "$NODE_IP" ]; then
   NODE_IP=$(kubectl get nodes -o jsonpath='{.items[0].status.addresses[?(@.type=="InternalIP")].address}' 2>/dev/null | grep -Eo '([0-9]{1,3}\.){3}[0-9]{1,3}' | head -n1)
fi

echo $NODE_IP
139.177.207.126

NODE_PORT=$(kubectl get svc kubeslice-ui-proxy -n kubeslice-controller -o jsonpath='{.spec.ports[0].nodePort}' 2>/dev/null)
echo "https://$NODE_IP:$NODE_PORT"
https://139.177.207.126:32185 -
For ClusterIP service type (port-forward required):
kubectl port-forward -n kubeslice-controller svc/kubeslice-ui-proxy 8080:443
echo "https://localhost:8080"
The output will be the Admin Portal URL. For example,
https://<EXTERNAL-IP>:<NODE-PORT>orhttps://<LOAD-BALANCER-IP>.Example Output
kubectl port-forward -n kubeslice-controller svc/kubeslice-ui-proxy 8080:443
echo "https://localhost:8080"
Forwarding from 127.0.0.1:8080 -> 8443
Forwarding from [::1]:8080 -> 8443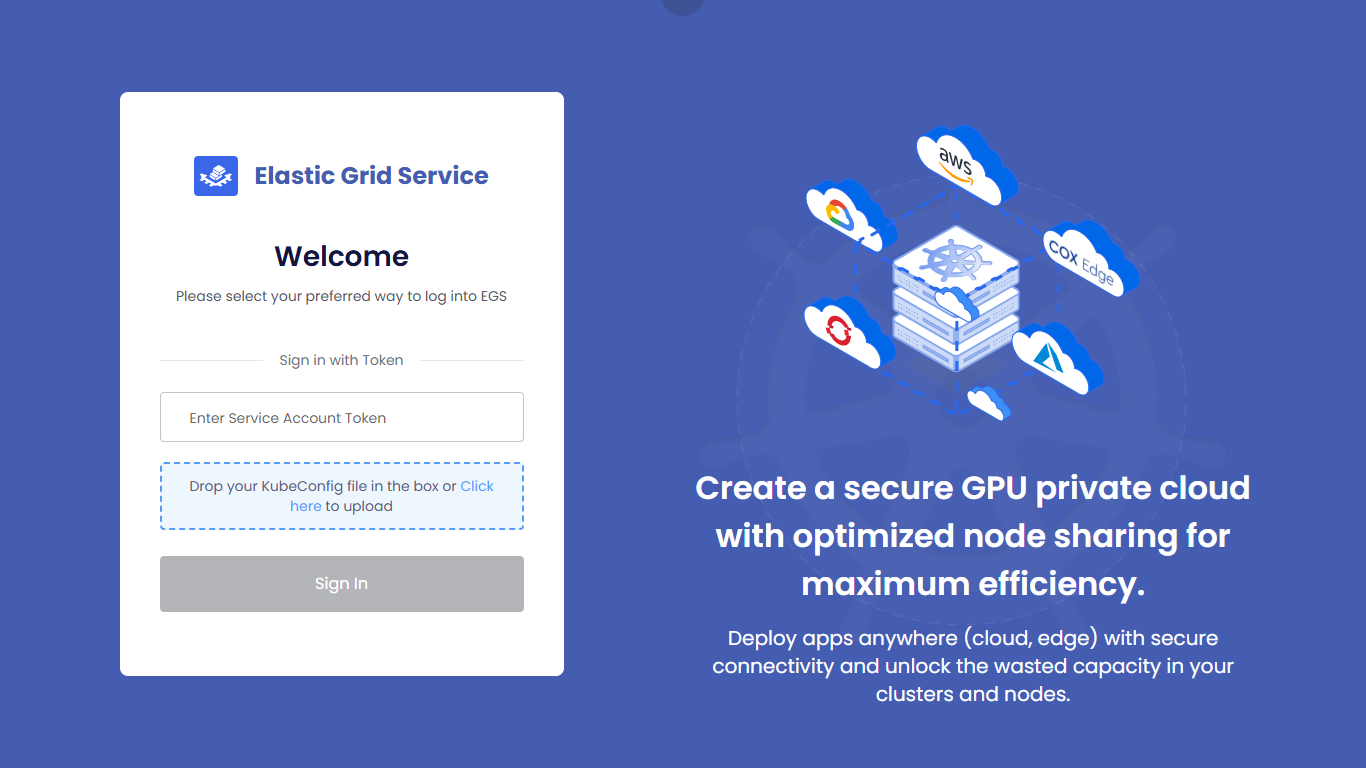
-
-
Get the admin access token, use the following command:
kubectl get secret kubeslice-rbac-rw-admin -o jsonpath="{.data.token}" -n kubeslice-avesha
Register a Worker Cluster
After a successful login, you can start using the EGS Admin Portal to manage your Kubernetes clusters and applications. It's essential to provide EGS at least one worker cluster for running jobs on GPU.
There are two options:
-
If your controller cluster also has GPU nodes, you can register the controller as a worker cluster by following the instructions in the Manual Cluster Registration topic.
-
If you have separate clusters with GPU nodes in addition to the controller cluster, you can register a worker cluster, create workspaces, and manage applications within the EGS environment. For more information on how to register a worker cluster, see Register a Worker Cluster.
Create a Workspace
After registering a worker cluster, you can create a workspace. A workspace is a logical boundary for a user or a team workspace. The workspace can be viewed as the workspace where users can deploy their AI workloads. For more information on how to create a workspace, see Create a Workspace.