EFK Logging
This topic provides instructions on installing the EFK stack, which is a suite of tools consisting of Elasticsearch, Fluentd, and Kibana, for log management. The EFK stack offers a centralized logging solution at the cluster level that enables the collection, search, and visualization of large amounts of data generated by pods. The installation process will be performed using the helm repository chart and involves the installation of Elasticsearch, Fluentd, and Kibana.
Prerequisites
To install KubeSlice, follow these prerequisites:
-
Ensure you have two or more clusters registered in your KubeSlice configuration. If not, see Install KubeSlice for more information.
-
Create the
loggingnamespace on the cluster using the following command:kubectl create ns logging
Elasticsearch
To install Elasticsearch, follow these steps:
-
Elasticsearch will create persistent volume automatically to store its persistent data. The default storage size is 2Gi.
-
The following information is required to install Elasticsearch:
| Parameter | Description |
|---|---|
<storage_size> | The storage size you provide during the installation. |
<namespace> | The namespace you created for the logging. |
Installing Elasticsearch
- Use the following command to install Elasticsearch:
helm upgrade --install elasticsearch kubeslice/elasticsearch --set elasticsearch.storage="<stroage_size>" -n <namespace>
For example:
helm upgrade --install elasticsearch kubeslice/elasticsearch --set elasticsearch.storage="10Gi" -n logging
Validate Elasticsearch
Use the following command to validate the installation:
kubectl get all -n logging
Example Output
NAME               READY   STATUS    RESTARTS   AGE
pod/es-cluster-0   1/1     Running   0          27s

NAME                             TYPE        CLUSTER-IP      EXTERNAL-IP   PORT(S)                         AGE
service/elasticsearch            ClusterIP   None            <none>        9200/TCP,9300/TCP               28s
service/elasticsearch-external   NodePort    172.20.127.64   <none>        9200:32369/TCP,9300:30605/TCP   28s

NAME                          READY   AGE
statefulset.apps/es-cluster   1/1     29s
Use the following command to validate if the persistent volume is created:
kubectl get pv,pvc -n logging
Example Output
NAME                                                        CAPACITY   ACCESS MODES   RECLAIM POLICY   STATUS   CLAIM                       STORAGECLASS   REASON   AGE
persistentvolume/pvc-6797bc21-338c-4e6e-8fc8-58213ef35a14   10Gi        RWO            Delete           Bound    logging/data-es-cluster-0   standard                62s

NAME                                      STATUS   VOLUME                                     CAPACITY   ACCESS MODES   STORAGECLASS   AGE
persistentvolumeclaim/data-es-cluster-0   Bound    pvc-6797bc21-338c-4e6e-8fc8-58213ef35a14   2Gi        RWO            standard       63s
Use the k get svc -n logging command to get the hostpath and the port.
The default hostPath is elasticsearch and the default port is 9200.
This completes the installation of Elasticsearch.
Fluentd
Fluentd is an open-source data collector for unifying log data. It is deployed as a Daemonset in Kubernetes to ensure that it runs on every node in the cluster, enabling it to collect logs from all pods running on those nodes. With Fluentd, you can easily collect, process, and ship logs to various destinations, including Elasticsearch.
The following information is required to install Fluentd.
| Parameter | Description |
|---|---|
<clustername> | The given name of your cluster. |
<provider> | The cloud provider. For example, aws, gcp, or azure. |
<namespace> | The namespace you created for the logging. |
<namespace1>,<namespace2> | The namespace from which you collect the logs. You can collect logs from multiple namespaces. For example, kubelice-system|kubelice-controller |
To collect logs from multiple namespaces, you can set the include_namespaces parameter with the list of namespaces,
separated by a pipe (|) character. Make sure to escape the pipe character with a backslash (\) before each namespace except
for the last one. This parameter allows Fluentd to collect logs from all the specified namespaces.
Installing Fluentd
Use the following command to install Fluentd:
helm upgrade --install fluentd kubeslice/fluentd -n <namespace> \
--set clustername=<clustername> \
--set provider=<provider> \
--set include_namespaces="<namespace1>\|<namespace2>"
This completes the successful installation of Fluentd.
Kibana
Kibana is a powerful web-based user interface that allows you to easily interact with Elasticsearch data. With Kibana, you can quickly and easily visualize, navigate, and share your data in a variety of ways, such as creating custom dashboards, charts, and graphs. Kibana provides powerful data exploration and analysis capabilities, enabling you to drill down into your data and uncover insights that might not be immediately apparent. It also provides a variety of plugins and extensions, making it highly extensible and customizable to meet your specific needs.
The following information is required to install Kibana.
| Parameter | Description |
|---|---|
<service_type> | Chose one of the service types: NodePort, ClusterIp, or Loadbalancer. |
<namespace> | The namespace you created for the logging. |
Installing Kibana
Use the following command to install Kibana:
helm upgrade --install kibana --set serviceType=<service_type> kubeslice/kibana -n <namespace>
Example:
helm upgrade --install kibana --set serviceType=NodePort kubeslice/kibana -n logging
This completes the successful installation of Kibana.
Use Kibana
After the successful installation of Elasticsearch, Fluentd, and Kibana, you can now log in to Kibana to visualize Elastic search data and navigate the Elastic stack.
Get External IP and NodePort
To access Kibana, you will need the external IP address of your node and the Nodeport of Kibana. Here's how to obtain the NodePort:
-
Run the following command to list the services belonging to the
loggingnamespace:kubectl get svc -n logging -
Locate the service named
kibana. The output will contain a column calledPORT(S), which displays theNodePortnumber for the Kibana service.
Once you have obtained the NodePort number, you can access Kibana using the external IP address of one of your nodes and the NodePort number.
Example Output
NAME                     TYPE        CLUSTER-IP     EXTERNAL-IP   PORT(S)                         AGE
elasticsearch            ClusterIP   None           <none>        9200/TCP,9300/TCP               5d1h
elasticsearch-external   NodePort    10.0.186.182   <none>        9200:32000/TCP,9300:30550/TCP   5d1h
kibana                   NodePort    10.0.205.212   <none>        5601:31211/TCP                  5d1h
In the above example, you get the Nodeport 31211.
Use the following command to get the external IP address of your node:
kubectl get nodes -o wide
Example Output
NAME                                                  STATUS   ROLES    AGE    VERSION             INTERNAL-IP   EXTERNAL-IP      OS-IMAGE                             KERNEL-VERSION   CONTAINER-RUNTIME
gke-spoke-gke-1-spoke-gke-1-main-pool-94b8d840-r442   Ready    <none>   5d2h   v1.20.15-gke.3600   10.6.0.5      35.237.248.108   Container-Optimized OS from Google   5.4.170+         containerd://1.4.8
gke-spoke-gke-1-spoke-gke-1-main-pool-94b8d840-t3cg   Ready    <none>   6d1h   v1.20.15-gke.3600   10.6.0.3      34.75.139.123    Container-Optimized OS from Google   5.4.170+         containerd://1.4.8
gke-spoke-gke-1-spoke-gke-1-secondary-a1c70d0e-skpj   Ready    <none>   2d1h   v1.20.15-gke.3600   10.6.0.11     35.229.121.251   Container-Optimized OS from Google   5.4.170+         containerd://1.4.8
Use the URL with the https://external-IP:NodePort/ format to access Kibana.
Create Index Patterns
An index pattern identifies one or more Elasticsearch indices that you want to explore with Kibana. The Kibana looks for index names that match the specified pattern.
To create an index pattern in Kibana:
- Log in to Kibana using the
<https//external-IP:NodePort>URL. For example, log in to http://35.237.248.108:31211/.
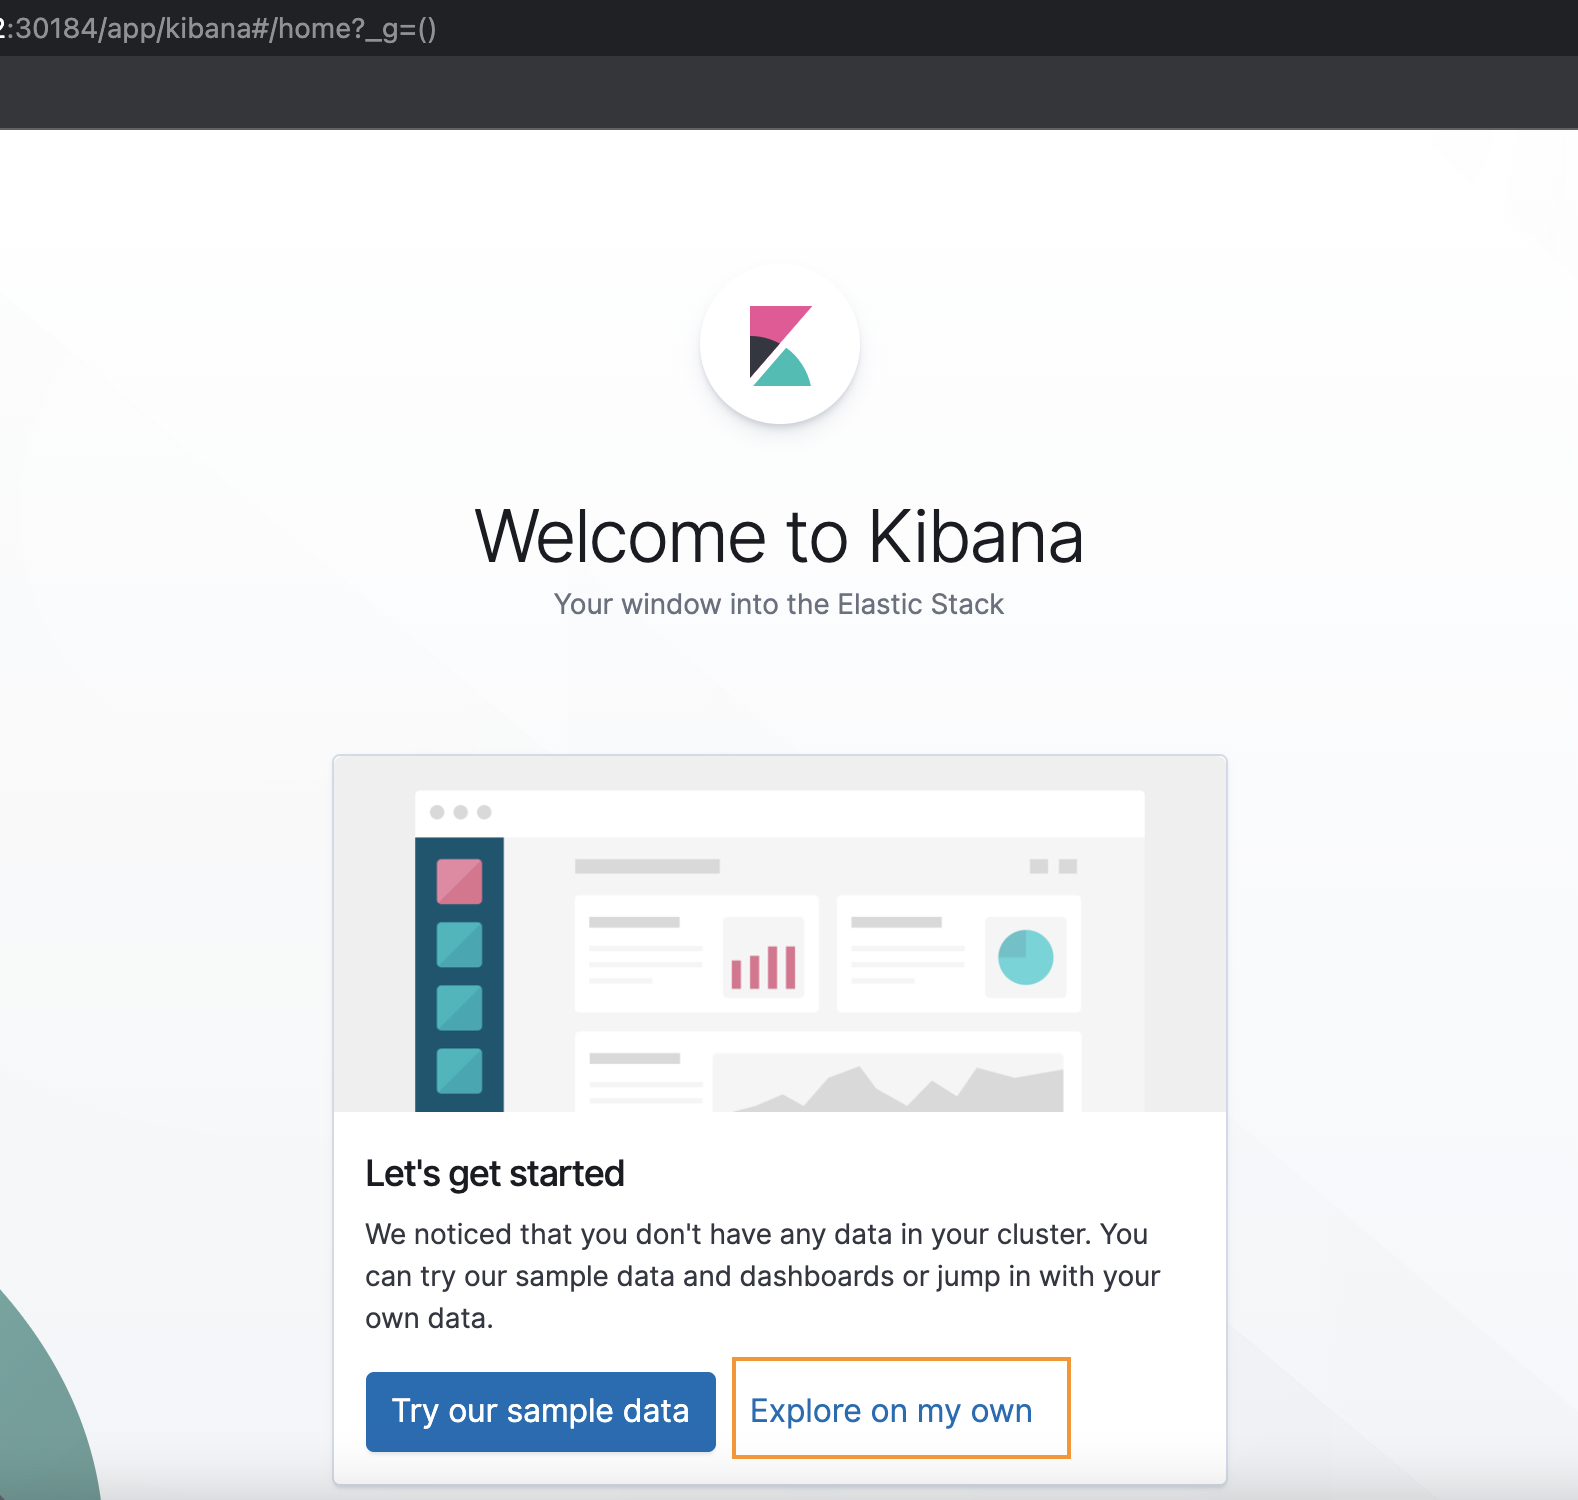
-
Click Explore on my own.
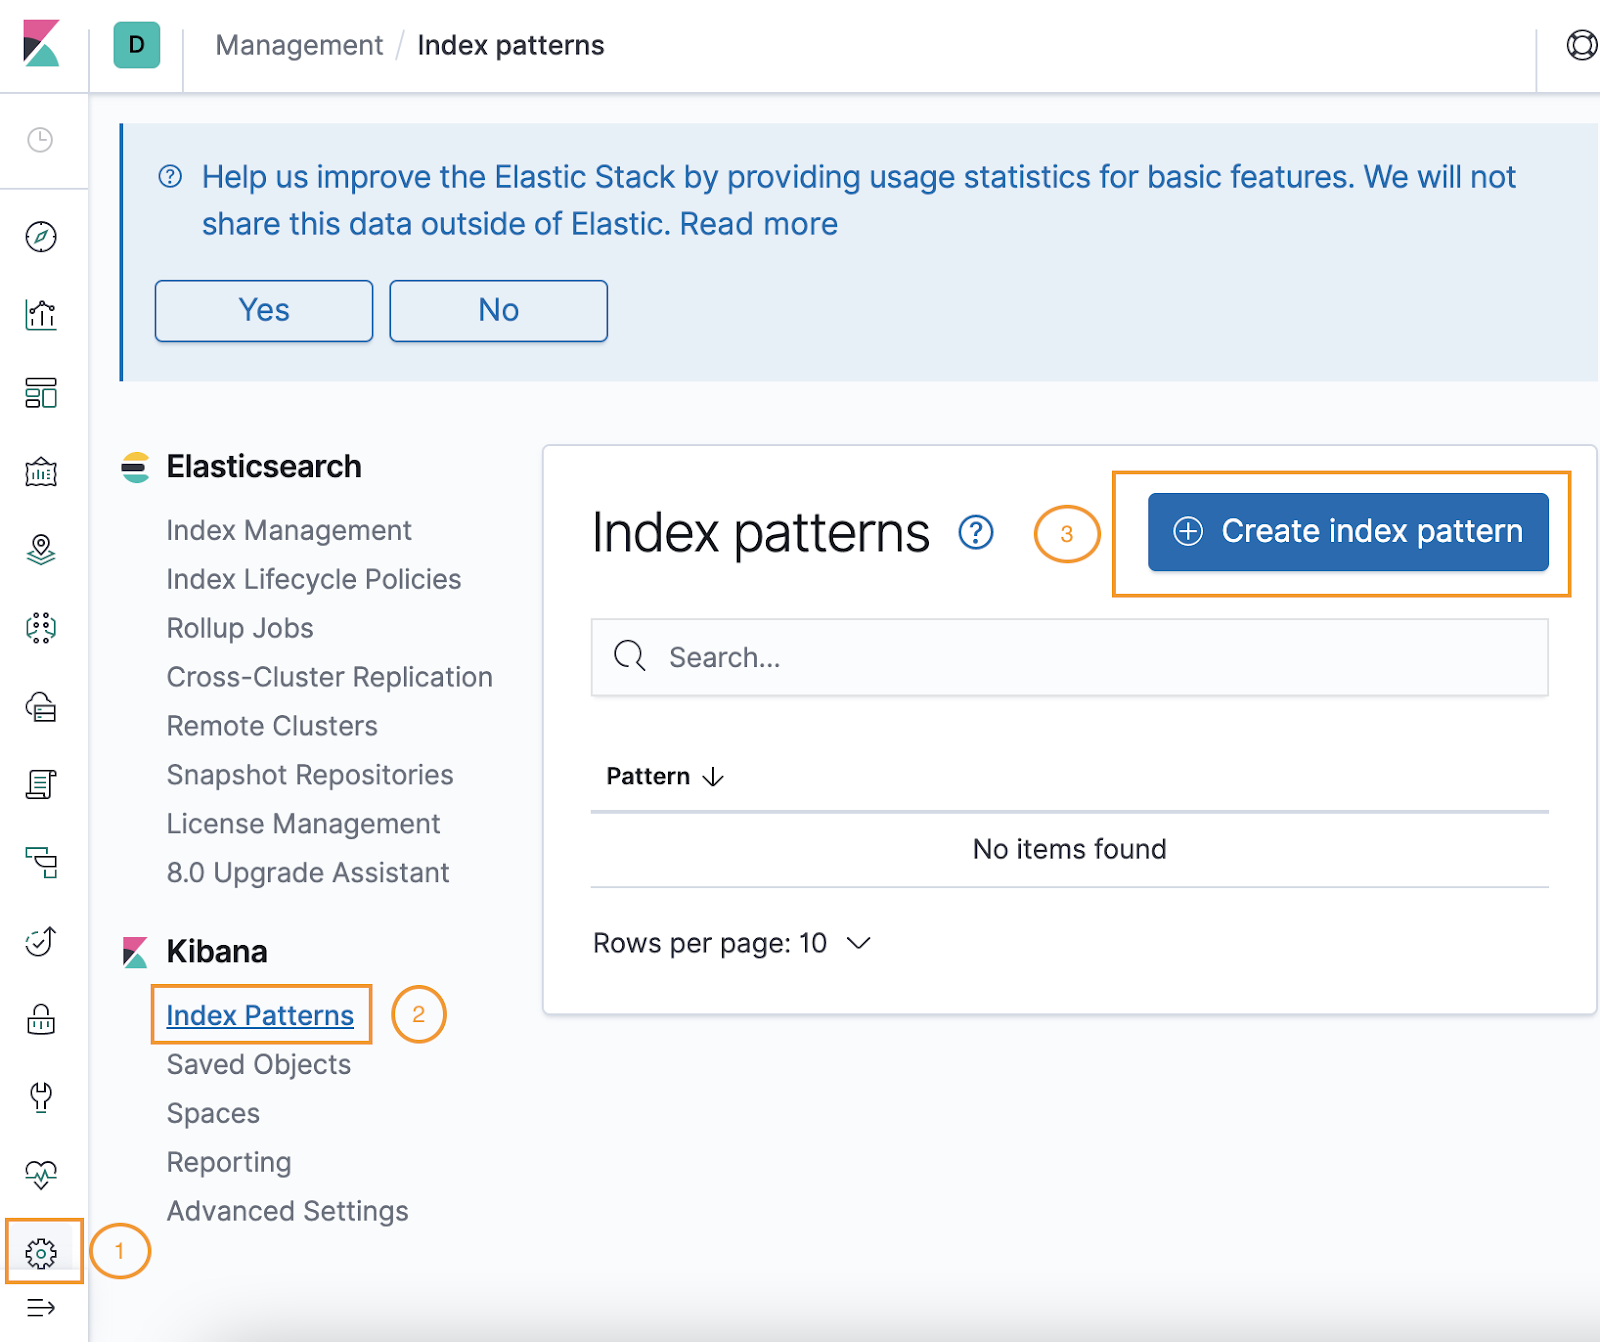
-
Click Management > Index Patterns.
-
Click the + icon next to Create Index Pattern.
-
On the Create Index Pattern page, enter these details.
-
For Step 1 of 2: Define Index Pattern, enter the matching suggestions and prefix with * for dates.
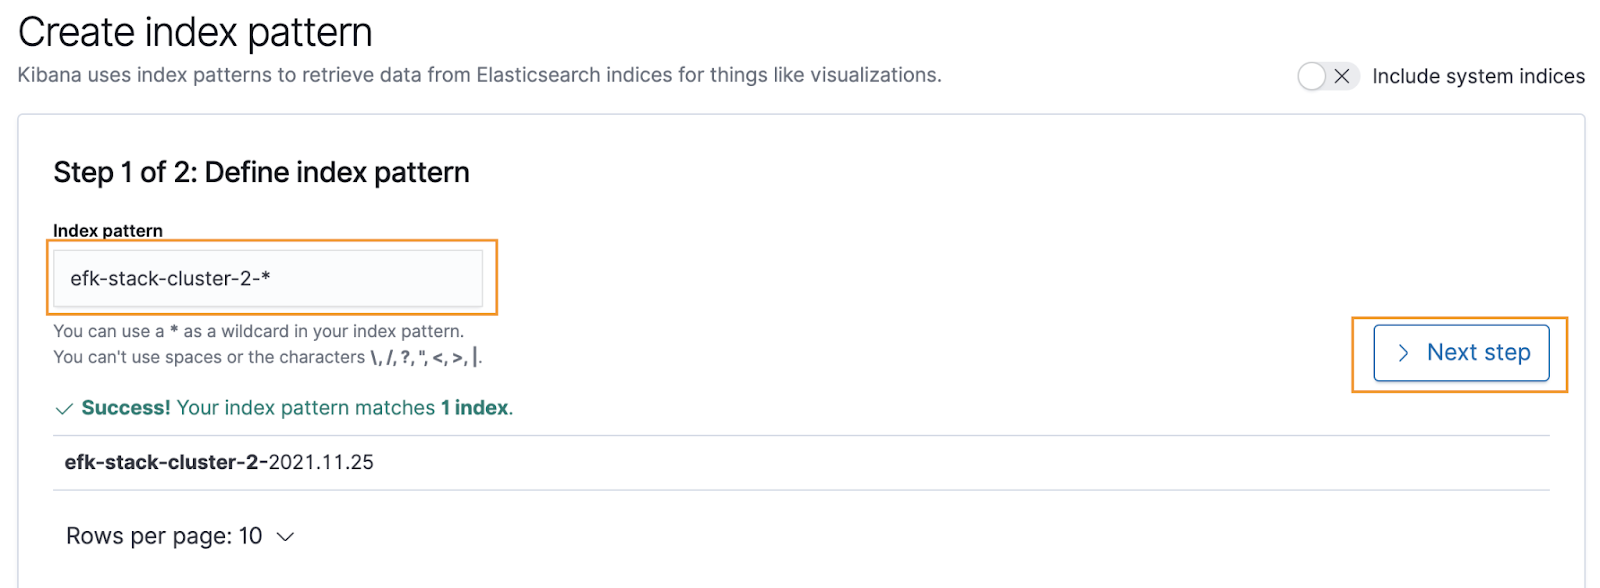
-
Click Next step.
-
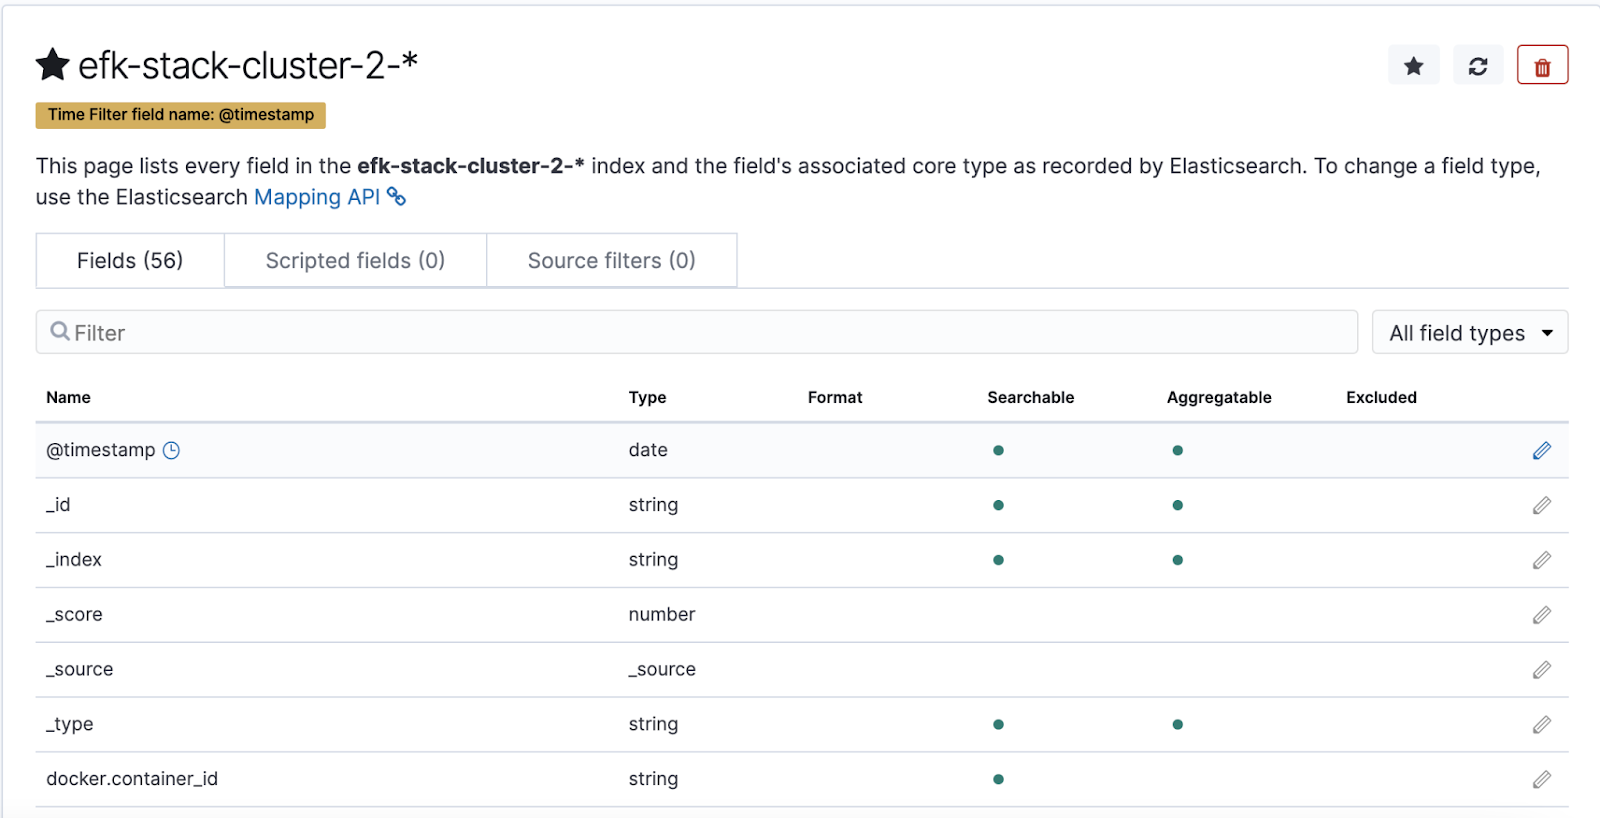
For Step 2 of 2: Configure Settings, select the @timestamp from the Time filter field name list and click Create index pattern.
The index pattern is available in the Kibana dashboard, as shown in the following example:
- On the top-left corner, click Discover.
The following figure illustrates the logs displayed.
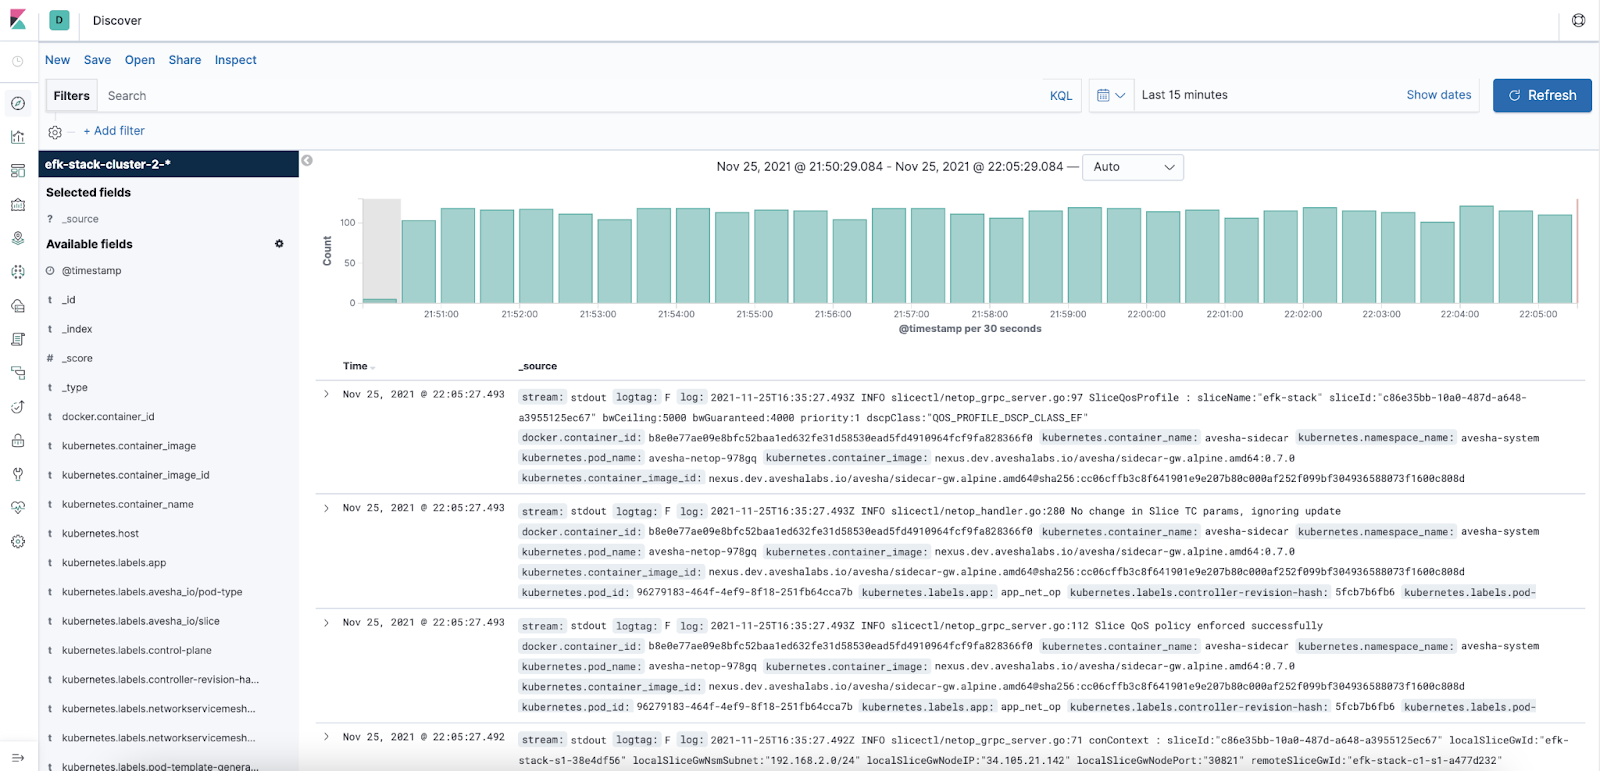
You have successfully configured and rolled out the EFK stack on your cluster.
Uninstall EFK
To uninstall the EFK stack from your cluster, you must uninstall the Fluentd, Kibana, Elasticsearch from the logging <namespace>,
and then delete the <namespace> created for logging.
| Parameter | Description |
|---|---|
<namespace> | The namespace you created for the logging. |
Fluentd
To uninstall EFK:
Use the following command to uninstall Fluentd:
helm uninstall fluentd -n <namespace>
Kibana
Use the following command to uninstall Kibana:
helm uninstall kibana -n <namespace>
Elasticsearch
Use the following command to uninstall Elasticsearch:
helm uninstall elasticsearch -n <namespace>
Logging Namespace
Use the following command to delete the logging namespace:
kubectl delete ns <namespace>
You have now successfully uninstalled EFK.