Monitor KubeSlice on Grafana
KubeSlice supports configuring a Grafana dashboard with Prometheus data through two separate JSON templates: one for the KubeSlice Controller and one for the Slice Operator.
The JSON templates helps you monitor the Prometheus metrics by importing them as dashboards into your Grafana account.
KubeSlice Controller Dashboard JSON
Import the JSON template into your account to configure a Grafana dashboard with KubeSlice Prometheus data source and monitor the KubeSlice Controller metrics.
Use the following template to add your property values, and import it as a dashboard into your Grafana account.
{
"annotations": {
"list": [
{
"builtIn": 1,
"datasource": {
"type": "grafana",
"uid": "-- Grafana --"
},
"enable": true,
"hide": true,
"iconColor": "rgba(0, 211, 255, 1)",
"name": "Annotations & Alerts",
"type": "dashboard"
}
]
},
"editable": true,
"fiscalYearStartMonth": 0,
"graphTooltip": 0,
"id": 11,
"links": [],
"liveNow": false,
"panels": [
{
"datasource": {
"default": false,
"type": "prometheus",
"uid": "${DS_PROMETHEUS}"
},
"fieldConfig": {
"defaults": {
"color": {
"mode": "thresholds"
},
"mappings": [],
"thresholds": {
"mode": "absolute",
"steps": [
{
"color": "green",
"value": null
},
{
"color": "red",
"value": 80
}
]
}
},
"overrides": []
},
"gridPos": {
"h": 8,
"w": 12,
"x": 0,
"y": 0
},
"id": 1,
"options": {
"colorMode": "value",
"graphMode": "area",
"justifyMode": "auto",
"orientation": "auto",
"percentChangeColorMode": "standard",
"reduceOptions": {
"calcs": [
"lastNotNull"
],
"fields": "",
"values": false
},
"showPercentChange": false,
"textMode": "auto",
"wideLayout": true
},
"pluginVersion": "11.2.2+security-01",
"targets": [
{
"datasource": {
"type": "prometheus",
"uid": "${DS_PROMETHEUS}"
},
"editorMode": "code",
"expr": "sum((kubeslice_controller_events_counter)) by (action)",
"instant": false,
"legendFormat": "__auto",
"range": true,
"refId": "A"
}
],
"title": "KubeSlice Controller Events Counter",
"type": "stat"
},
{
"datasource": {
"default": false,
"type": "prometheus",
"uid": "${DS_PROMETHEUS}"
},
"fieldConfig": {
"defaults": {
"color": {
"mode": "thresholds"
},
"mappings": [],
"thresholds": {
"mode": "absolute",
"steps": [
{
"color": "green",
"value": null
},
{
"color": "red",
"value": 80
}
]
}
},
"overrides": []
},
"gridPos": {
"h": 8,
"w": 12,
"x": 12,
"y": 0
},
"id": 4,
"options": {
"minVizHeight": 75,
"minVizWidth": 75,
"orientation": "auto",
"reduceOptions": {
"calcs": [
"lastNotNull"
],
"fields": "",
"values": false
},
"showThresholdLabels": false,
"showThresholdMarkers": true,
"sizing": "auto"
},
"pluginVersion": "11.2.2+security-01",
"targets": [
{
"datasource": {
"type": "prometheus",
"uid": "${DS_PROMETHEUS}"
},
"editorMode": "code",
"expr": "purchased_vcpu_bundle",
"instant": false,
"legendFormat": "__auto",
"range": true,
"refId": "A"
}
],
"title": "Purchased vCPU bundle count metrics",
"type": "gauge"
},
{
"datasource": {
"default": false,
"type": "prometheus",
"uid": "${DS_PROMETHEUS}"
},
"fieldConfig": {
"defaults": {
"color": {
"mode": "thresholds"
},
"mappings": [],
"thresholds": {
"mode": "absolute",
"steps": [
{
"color": "green",
"value": null
},
{
"color": "yellow",
"value": 70
},
{
"color": "red",
"value": 90
}
]
}
},
"overrides": []
},
"gridPos": {
"h": 8,
"w": 12,
"x": 0,
"y": 8
},
"id": 3,
"options": {
"minVizHeight": 75,
"minVizWidth": 75,
"orientation": "auto",
"reduceOptions": {
"calcs": [
"lastNotNull"
],
"fields": "",
"values": false
},
"showThresholdLabels": false,
"showThresholdMarkers": true,
"sizing": "auto"
},
"pluginVersion": "11.2.2+security-01",
"targets": [
{
"datasource": {
"type": "prometheus",
"uid": "${DS_PROMETHEUS}"
},
"editorMode": "code",
"expr": "vcpu_license_violation",
"instant": false,
"legendFormat": "__auto",
"range": true,
"refId": "A"
}
],
"title": "vCPU violation metrics",
"type": "gauge"
},
{
"datasource": {
"default": false,
"type": "prometheus",
"uid": "${DS_PROMETHEUS}"
},
"fieldConfig": {
"defaults": {
"color": {
"mode": "thresholds"
},
"mappings": [],
"thresholds": {
"mode": "absolute",
"steps": [
{
"color": "green",
"value": null
},
{
"color": "red",
"value": 80
}
]
}
},
"overrides": []
},
"gridPos": {
"h": 8,
"w": 12,
"x": 12,
"y": 8
},
"id": 6,
"options": {
"colorMode": "value",
"graphMode": "area",
"justifyMode": "auto",
"orientation": "auto",
"percentChangeColorMode": "standard",
"reduceOptions": {
"calcs": [
"lastNotNull"
],
"fields": "",
"values": false
},
"showPercentChange": false,
"textMode": "auto",
"wideLayout": true
},
"pluginVersion": "11.2.2+security-01",
"targets": [
{
"datasource": {
"type": "prometheus",
"uid": "${DS_PROMETHEUS}"
},
"editorMode": "code",
"expr": "vcpu_usage_total",
"instant": false,
"legendFormat": "__auto",
"range": true,
"refId": "A"
}
],
"title": "vCPU Usage Over Time",
"type": "stat"
}
],
"refresh": "5m",
"schemaVersion": 39,
"tags": [
"Kubeslice-avesha"
],
"templating": {
"list": [
{
"current": {
"selected": false,
"text": "All",
"value": "$__all"
},
"datasource": {
"type": "prometheus",
"uid": "${DS_PROMETHEUS}"
},
"definition": "label_values(kubeslice_controller_events_counter, slice_name)",
"hide": 0,
"includeAll": true,
"label": "Slice Name",
"multi": false,
"name": "slice_name",
"options": [],
"query": {
"query": "label_values(kubeslice_controller_events_counter, slice_name)",
"refId": "StandardVariableQuery"
},
"refresh": 1,
"regex": "",
"skipUrlSync": false,
"sort": 0,
"type": "query"
},
{
"current": {
"selected": false,
"text": "All",
"value": "$__all"
},
"datasource": {
"type": "prometheus",
"uid": "${DS_PROMETHEUS}"
},
"definition": "label_values(kubeslice_controller_events_counter, slice_project)",
"hide": 0,
"includeAll": true,
"label": "Slice Project",
"multi": false,
"name": "slice_project",
"options": [],
"query": {
"query": "label_values(kubeslice_controller_events_counter, slice_project)",
"refId": "StandardVariableQuery"
},
"refresh": 1,
"regex": "",
"skipUrlSync": false,
"sort": 0,
"type": "query"
},
{
"current": {
"selected": false,
"text": "All",
"value": "$__all"
},
"datasource": {
"type": "prometheus",
"uid": "${DS_PROMETHEUS}"
},
"definition": "label_values(kubeslice_controller_events_counter, slice_cluster)",
"hide": 0,
"includeAll": true,
"label": "Slice Cluster",
"multi": false,
"name": "slice_cluster",
"options": [],
"query": {
"query": "label_values(kubeslice_controller_events_counter, slice_cluster)",
"refId": "StandardVariableQuery"
},
"refresh": 1,
"regex": "",
"skipUrlSync": false,
"sort": 0,
"type": "query"
}
]
},
"time": {
"from": "now-6h",
"to": "now"
},
"timepicker": {},
"timezone": "",
"title": "KubeSlice Controller Metrics Dashboard",
"uid": "kubeslice-controller-metrics-avesha",
"version": 6,
"weekStart": "",
"__inputs": [
{
"name": "DS_PROMETHEUS",
"label": "Prometheus",
"description": "",
"type": "datasource",
"pluginId": "prometheus",
"pluginName": "Prometheus"
}
]
}
Slice Operator Dashboard JSON
Import the JSON template into your account to configure a Grafana dashboard with KubeSlice Prometheus data source and monitor the Slice Operator metrics.
Use the following template to add your property values, and import it as a dashboard into your Grafana account.
{
"annotations": {
"list": [
{
"builtIn": 1,
"datasource": {
"type": "grafana",
"uid": "-- Grafana --"
},
"enable": true,
"hide": true,
"iconColor": "rgba(0, 211, 255, 1)",
"name": "Annotations & Alerts",
"type": "dashboard"
}
]
},
"editable": true,
"fiscalYearStartMonth": 0,
"graphTooltip": 0,
"id": 9,
"links": [],
"templating": {
"list": [
{
"current": {
"selected": false,
"text": "Prometheus",
"value": "Prometheus"
},
"hide": 0,
"includeAll": false,
"multi": false,
"name": "datasource",
"options": [],
"query": "prometheus",
"queryValue": "",
"refresh": 1,
"regex": "",
"skipUrlSync": false,
"type": "datasource"
}
]
},
"panels": [
{
"datasource": {
"type": "prometheus",
"uid": "${DS_PROMETHEUS}"
},
"fieldConfig": {
"defaults": {
"color": {
"mode": "thresholds"
},
"mappings": [],
"thresholds": {
"mode": "absolute",
"steps": [
{
"color": "green",
"value": null
},
{
"color": "red",
"value": 80
}
]
},
"unit": "short"
},
"overrides": []
},
"gridPos": {
"h": 8,
"w": 12,
"x": 0,
"y": 0
},
"id": 1,
"options": {
"minVizHeight": 75,
"minVizWidth": 75,
"orientation": "auto",
"reduceOptions": {
"calcs": [
"lastNotNull"
],
"fields": "",
"values": false
},
"showThresholdLabels": false,
"showThresholdMarkers": true,
"sizing": "auto"
},
"targets": [
{
"datasource": {
"type": "prometheus",
"uid": "${DS_PROMETHEUS}"
},
"editorMode": "code",
"expr": "kubeslice_serviceimport_endpoints",
"instant": false,
"legendFormat": "__auto",
"range": true,
"refId": "A"
}
],
"title": "Service Import Endpoints",
"type": "gauge"
},
{
"datasource": {
"type": "prometheus",
"uid": "${DS_PROMETHEUS}"
},
"fieldConfig": {
"defaults": {
"color": {
"mode": "palette-classic"
},
"custom": {
"hideFrom": {
"legend": false,
"tooltip": false,
"viz": false
}
},
"mappings": [],
"unit": "short"
},
"overrides": []
},
"gridPos": {
"h": 8,
"w": 12,
"x": 12,
"y": 0
},
"id": 2,
"options": {
"legend": {
"displayMode": "list",
"placement": "bottom",
"showLegend": true
},
"pieType": "pie",
"reduceOptions": {
"calcs": [
"lastNotNull"
],
"fields": "",
"values": false
},
"tooltip": {
"mode": "single",
"sort": "none"
}
},
"targets": [
{
"datasource": {
"type": "prometheus",
"uid": "${DS_PROMETHEUS}"
},
"editorMode": "code",
"expr": "kubeslice_serviceexport_endpoints > 0",
"instant": false,
"legendFormat": "__auto",
"range": true,
"refId": "A"
}
],
"title": "Service Export Endpoints",
"type": "piechart"
},
{
"datasource": {
"type": "prometheus",
"uid": "${DS_PROMETHEUS}"
},
"fieldConfig": {
"defaults": {
"color": {
"mode": "palette-classic"
},
"custom": {
"hideFrom": {
"legend": false,
"tooltip": false,
"viz": false
}
},
"mappings": [],
"unit": "short"
},
"overrides": []
},
"gridPos": {
"h": 8,
"w": 12,
"x": 0,
"y": 8
},
"id": 3,
"options": {
"legend": {
"displayMode": "list",
"placement": "bottom",
"showLegend": true
},
"pieType": "pie",
"reduceOptions": {
"calcs": [
"lastNotNull"
],
"fields": "",
"values": false
},
"tooltip": {
"mode": "single",
"sort": "none"
}
},
"targets": [
{
"datasource": {
"type": "prometheus",
"uid": "${DS_PROMETHEUS}"
},
"editorMode": "code",
"expr": "sum (kubeslice_app_pods) by ( slice_namespace )",
"instant": false,
"legendFormat": "__auto",
"range": true,
"refId": "A"
}
],
"title": "Application Pods per Slice Namespace",
"type": "piechart"
},
{
"datasource": {
"type": "prometheus",
"uid": "${DS_PROMETHEUS}"
},
"description": "Denotes 1 if the worker cluster is healthy",
"fieldConfig": {
"defaults": {
"color": {
"mode": "thresholds"
},
"mappings": [],
"thresholds": {
"mode": "absolute",
"steps": [
{
"color": "green",
"value": null
},
{
"color": "red",
"value": 80
}
]
}
},
"overrides": []
},
"gridPos": {
"h": 8,
"w": 12,
"x": 12,
"y": 8
},
"id": 4,
"options": {
"minVizHeight": 75,
"minVizWidth": 75,
"orientation": "auto",
"reduceOptions": {
"calcs": [
"lastNotNull"
],
"fields": "",
"values": false
},
"showThresholdLabels": false,
"showThresholdMarkers": true,
"sizing": "auto"
},
"targets": [
{
"datasource": {
"type": "prometheus",
"uid": "${DS_PROMETHEUS}"
},
"editorMode": "code",
"expr": "kubeslice_cluster_up",
"instant": false,
"legendFormat": "__auto",
"range": true,
"refId": "A"
}
],
"title": "Worker Cluster Health, Denotes 1 if the worker cluster is healthy",
"type": "gauge"
},
{
"datasource": {
"type": "prometheus",
"uid": "${DS_PROMETHEUS}"
},
"fieldConfig": {
"defaults": {
"color": {
"mode": "palette-classic"
},
"custom": {
"hideFrom": {
"legend": false,
"tooltip": false,
"viz": false
}
},
"mappings": [],
"max": 1,
"min": 0,
"unit": "short"
},
"overrides": []
},
"gridPos": {
"h": 8,
"w": 12,
"x": 0,
"y": 16
},
"id": 5,
"options": {
"legend": {
"displayMode": "list",
"placement": "bottom",
"showLegend": true
},
"pieType": "pie",
"reduceOptions": {
"calcs": [
"lastNotNull"
],
"fields": "",
"values": false
},
"tooltip": {
"mode": "single",
"sort": "none"
}
},
"targets": [
{
"datasource": {
"type": "prometheus",
"uid": "${DS_PROMETHEUS}"
},
"editorMode": "code",
"expr": "kubeslice_cluster_component_up > 0",
"instant": false,
"legendFormat": "__auto",
"range": true,
"refId": "A"
}
],
"title": "kubeslice cluster component which is up",
"type": "piechart"
},
{
"datasource": {
"type": "prometheus",
"uid": "${DS_PROMETHEUS}"
},
"fieldConfig": {
"defaults": {
"mappings": [],
"thresholds": {
"mode": "absolute",
"steps": [
{
"color": "green",
"value": null
},
{
"color": "red",
"value": 80
}
]
},
"unit": "short"
},
"overrides": []
},
"gridPos": {
"h": 8,
"w": 12,
"x": 12,
"y": 16
},
"id": 6,
"options": {
"colorMode": "background",
"graphMode": "none",
"justifyMode": "auto",
"orientation": "auto",
"percentChangeColorMode": "standard",
"reduceOptions": {
"calcs": [
"lastNotNull"
],
"fields": "",
"values": false
},
"showPercentChange": false,
"textMode": "auto",
"wideLayout": true
},
"targets": [
{
"datasource": {
"type": "prometheus",
"uid": "${DS_PROMETHEUS}"
},
"editorMode": "code",
"expr": "kubeslice_slice_up",
"instant": false,
"legendFormat": "__auto",
"range": true,
"refId": "A"
}
],
"title": "Slice Health, Denotes 1 if the slice is healthy",
"type": "stat"
},
{
"datasource": {
"type": "prometheus",
"uid": "${DS_PROMETHEUS}"
},
"fieldConfig": {
"defaults": {
"color": {
"mode": "continuous-GrYlRd"
},
"custom": {
"fillOpacity": 70,
"hideFrom": {
"legend": false,
"tooltip": false,
"viz": false
},
"insertNulls": false,
"lineWidth": 0,
"spanNulls": false
},
"mappings": [],
"thresholds": {
"mode": "absolute",
"steps": [
{
"color": "green",
"value": null
},
{
"color": "red",
"value": 80
}
]
}
},
"overrides": []
},
"gridPos": {
"h": 8,
"w": 12,
"x": 0,
"y": 24
},
"id": 7,
"options": {
"alignValue": "left",
"legend": {
"displayMode": "list",
"placement": "bottom",
"showLegend": true
},
"mergeValues": true,
"rowHeight": 0.9,
"showValue": "auto",
"tooltip": {
"mode": "single",
"sort": "none"
}
},
"targets": [
{
"datasource": {
"type": "prometheus",
"uid": "${DS_PROMETHEUS}"
},
"editorMode": "code",
"expr": "kubeslice_slice_component_up > 0",
"instant": false,
"legendFormat": "__auto",
"range": true,
"refId": "A"
}
],
"title": "slice component which is healthy",
"type": "state-timeline"
},
{
"datasource": {
"type": "prometheus",
"uid": "${DS_PROMETHEUS}"
},
"fieldConfig": {
"defaults": {
"color": {
"mode": "palette-classic"
},
"custom": {
"axisBorderShow": false,
"axisCenteredZero": false,
"axisColorMode": "text",
"axisLabel": "",
"axisPlacement": "auto",
"barAlignment": 0,
"barWidthFactor": 0.6,
"drawStyle": "line",
"fillOpacity": 25,
"gradientMode": "none",
"hideFrom": {
"legend": false,
"tooltip": false,
"viz": false
},
"insertNulls": false,
"lineInterpolation": "linear",
"lineWidth": 1,
"pointSize": 5,
"scaleDistribution": {
"type": "linear"
},
"showPoints": "auto",
"spanNulls": false,
"stacking": {
"group": "A",
"mode": "none"
},
"thresholdsStyle": {
"mode": "off"
}
},
"mappings": [],
"thresholds": {
"mode": "absolute",
"steps": [
{
"color": "green",
"value": null
},
{
"color": "red",
"value": 80
}
]
}
},
"overrides": []
},
"gridPos": {
"h": 8,
"w": 12,
"x": 12,
"y": 24
},
"id": 8,
"options": {
"legend": {
"calcs": [],
"displayMode": "hidden",
"placement": "right",
"showLegend": false
},
"tooltip": {
"mode": "single",
"sort": "none"
}
},
"targets": [
{
"datasource": {
"type": "prometheus",
"uid": "${DS_PROMETHEUS}"
},
"editorMode": "code",
"expr": "kubeslice_slice_updated_total",
"instant": false,
"legendFormat": "__auto",
"range": true,
"refId": "A"
}
],
"title": "slice related events counter for updated event",
"type": "timeseries"
},
{
"datasource": {
"type": "prometheus",
"uid": "${DS_PROMETHEUS}"
},
"fieldConfig": {
"defaults": {
"color": {
"mode": "thresholds"
},
"mappings": [],
"thresholds": {
"mode": "absolute",
"steps": [
{
"color": "green",
"value": null
},
{
"color": "red",
"value": 80
}
]
},
"unit": "short"
},
"overrides": []
},
"gridPos": {
"h": 8,
"w": 12,
"x": 0,
"y": 32
},
"id": 9,
"options": {
"minVizHeight": 75,
"minVizWidth": 75,
"orientation": "auto",
"reduceOptions": {
"calcs": [
"lastNotNull"
],
"fields": "",
"values": false
},
"showThresholdLabels": false,
"showThresholdMarkers": true,
"sizing": "auto"
},
"targets": [
{
"datasource": {
"type": "prometheus",
"uid": "${DS_PROMETHEUS}"
},
"editorMode": "code",
"expr": "kubeslice_nodeaffinity_taints_active",
"instant": false,
"legendFormat": "__auto",
"range": true,
"refId": "A"
}
],
"title": "Number of nodes tainted for Node Affinity in the slice",
"type": "gauge"
},
{
"datasource": {
"type": "prometheus",
"uid": "${DS_PROMETHEUS}"
},
"fieldConfig": {
"defaults": {
"color": {
"mode": "thresholds"
},
"mappings": [],
"thresholds": {
"mode": "absolute",
"steps": [
{
"color": "green",
"value": null
},
{
"color": "red",
"value": 80
}
]
},
"unit": "short"
},
"overrides": []
},
"gridPos": {
"h": 8,
"w": 12,
"x": 12,
"y": 32
},
"id": 10,
"options": {
"minVizHeight": 75,
"minVizWidth": 75,
"orientation": "auto",
"reduceOptions": {
"calcs": [
"lastNotNull"
],
"fields": "",
"values": false
},
"showThresholdLabels": false,
"showThresholdMarkers": true,
"sizing": "auto"
},
"targets": [
{
"datasource": {
"type": "prometheus",
"uid": "${DS_PROMETHEUS}"
},
"editorMode": "code",
"expr": "kubeslice_nodeaffinity_mutated_workloads_total",
"instant": false,
"legendFormat": "__auto",
"range": true,
"refId": "A"
}
],
"title": "Count of workloads mutated by webhook for Node Affinity.",
"type": "gauge"
},
{
"datasource": {
"type": "prometheus",
"uid": "${DS_PROMETHEUS}"
},
"fieldConfig": {
"defaults": {
"color": {
"mode": "thresholds"
},
"mappings": [],
"thresholds": {
"mode": "absolute",
"steps": [
{
"color": "green",
"value": null
},
{
"color": "red",
"value": 80
}
]
},
"unit": "short"
},
"overrides": []
},
"gridPos": {
"h": 8,
"w": 12,
"x": 0,
"y": 40
},
"id": 11,
"options": {
"minVizHeight": 75,
"minVizWidth": 75,
"orientation": "auto",
"reduceOptions": {
"calcs": [
"lastNotNull"
],
"fields": "",
"values": false
},
"showThresholdLabels": false,
"showThresholdMarkers": true,
"sizing": "auto"
},
"targets": [
{
"datasource": {
"type": "prometheus",
"uid": "${DS_PROMETHEUS}"
},
"editorMode": "code",
"expr": "sum(rate(no_updates_received_since_72_hours_total[5m])) by (cluster_name)",
"instant": false,
"legendFormat": "__auto",
"range": true,
"refId": "A"
}
],
"title": "No Updates Received (72 hours) - Freshness check count",
"type": "gauge"
},
{
"datasource": {
"type": "prometheus",
"uid": "${DS_PROMETHEUS}"
},
"fieldConfig": {
"defaults": {
"color": {
"mode": "thresholds"
},
"mappings": [],
"thresholds": {
"mode": "absolute",
"steps": [
{
"color": "green",
"value": null
},
{
"color": "red",
"value": 80
}
]
},
"unit": "short"
},
"overrides": []
},
"gridPos": {
"h": 8,
"w": 12,
"x": 12,
"y": 40
},
"id": 12,
"options": {
"minVizHeight": 75,
"minVizWidth": 75,
"orientation": "auto",
"reduceOptions": {
"calcs": [
"lastNotNull"
],
"fields": "",
"values": false
},
"showThresholdLabels": false,
"showThresholdMarkers": true,
"sizing": "auto"
},
"targets": [
{
"datasource": {
"type": "prometheus",
"uid": "${DS_PROMETHEUS}"
},
"editorMode": "code",
"expr": "sum(rate(v_cpu_usage_exceed[5m])) by (cluster_name)",
"instant": false,
"legendFormat": "__auto",
"range": true,
"refId": "A"
}
],
"title": "V-CPU Usages exceed count",
"type": "gauge"
},
{
"datasource": {
"type": "prometheus",
"uid": "${DS_PROMETHEUS}"
},
"fieldConfig": {
"defaults": {
"color": {
"mode": "thresholds"
},
"mappings": [],
"thresholds": {
"mode": "absolute",
"steps": [
{
"color": "green",
"value": null
},
{
"color": "red",
"value": 80
}
]
},
"unit": "short"
},
"overrides": []
},
"gridPos": {
"h": 8,
"w": 12,
"x": 0,
"y": 48
},
"id": 13,
"options": {
"minVizHeight": 75,
"minVizWidth": 75,
"orientation": "auto",
"reduceOptions": {
"calcs": [
"lastNotNull"
],
"fields": "",
"values": false
},
"showThresholdLabels": false,
"showThresholdMarkers": true,
"sizing": "auto"
},
"targets": [
{
"datasource": {
"type": "prometheus",
"uid": "${DS_PROMETHEUS}"
},
"editorMode": "code",
"expr": "sum(rate(warning_no_updates_recieved_since_30_minutes[5m])) by (cluster_name)",
"instant": false,
"legendFormat": "__auto",
"range": true,
"refId": "A"
}
],
"title": "Warnings - No Updates Received (30 minutes)",
"type": "gauge"
}
],
"schemaVersion": 39,
"tags": [
"kubeslice-avesha"
],
"time": {
"from": "now-6h",
"to": "now"
},
"timepicker": {},
"timezone": "",
"title": "KubeSlice Operator Metrics Dashboard",
"uid": "kubeslice-operator-metrics-avesha",
"version": 40,
"weekStart": "",
"__inputs": [
{
"name": "DS_PROMETHEUS",
"label": "Prometheus",
"description": "",
"type": "datasource",
"pluginId": "prometheus",
"pluginName": "Prometheus"
}
]
}
Import the Dashboard JSON Template
After you have added your values into the KubeSlice Controller and the Slice Operator JSON templates, you can import them as dashboards into your Grafana account.
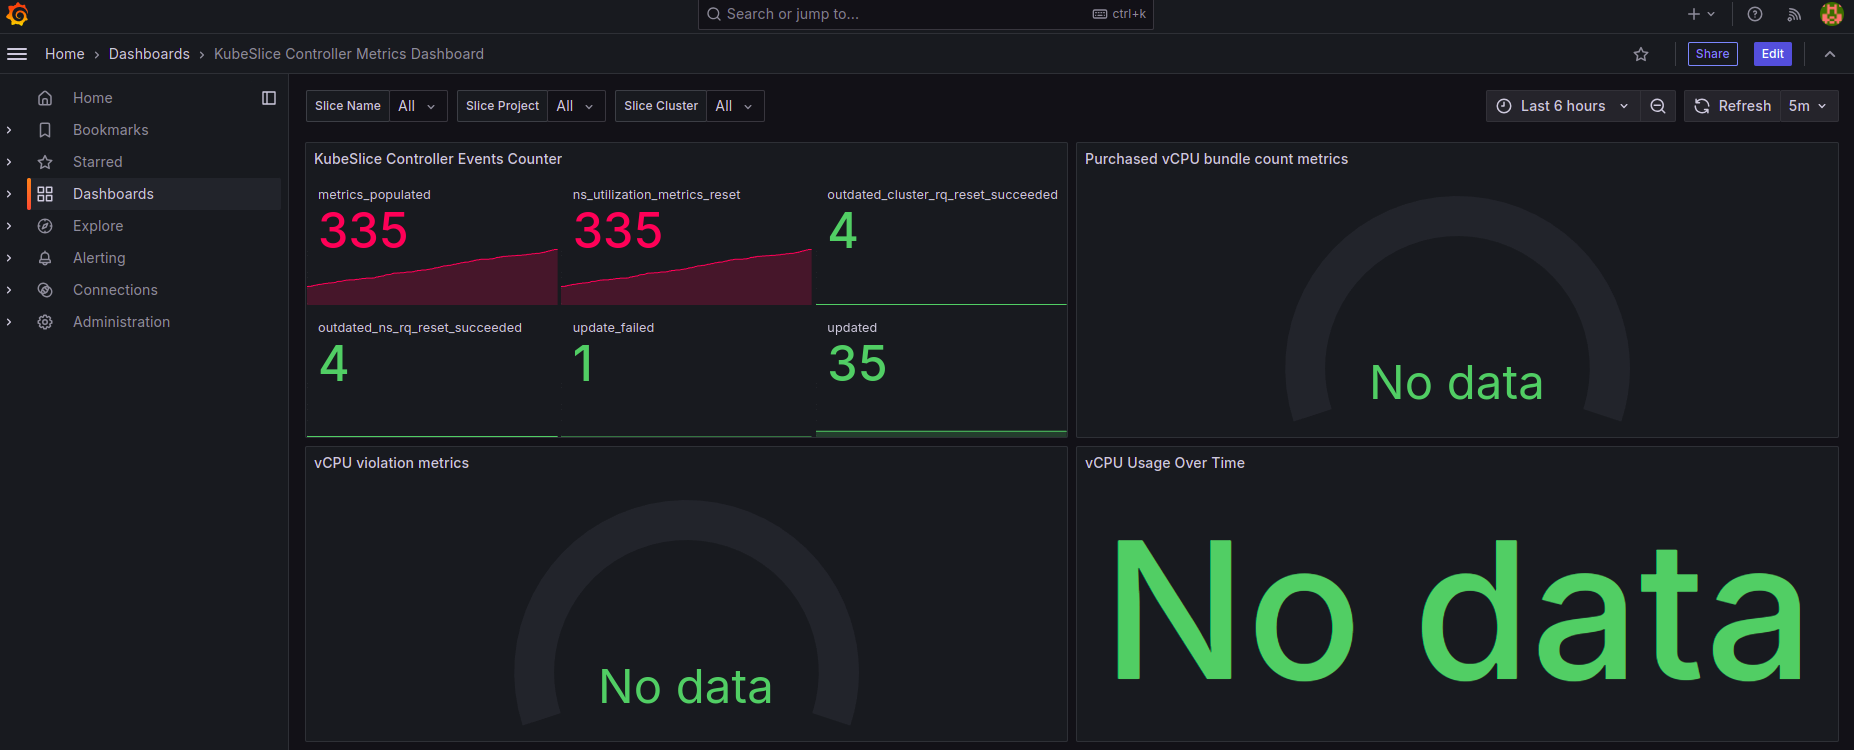
The dashboard displays no data when the metrics are unavailable.
The following figure shows the KubeSlice Controller metrics on a Grafana dashboard.
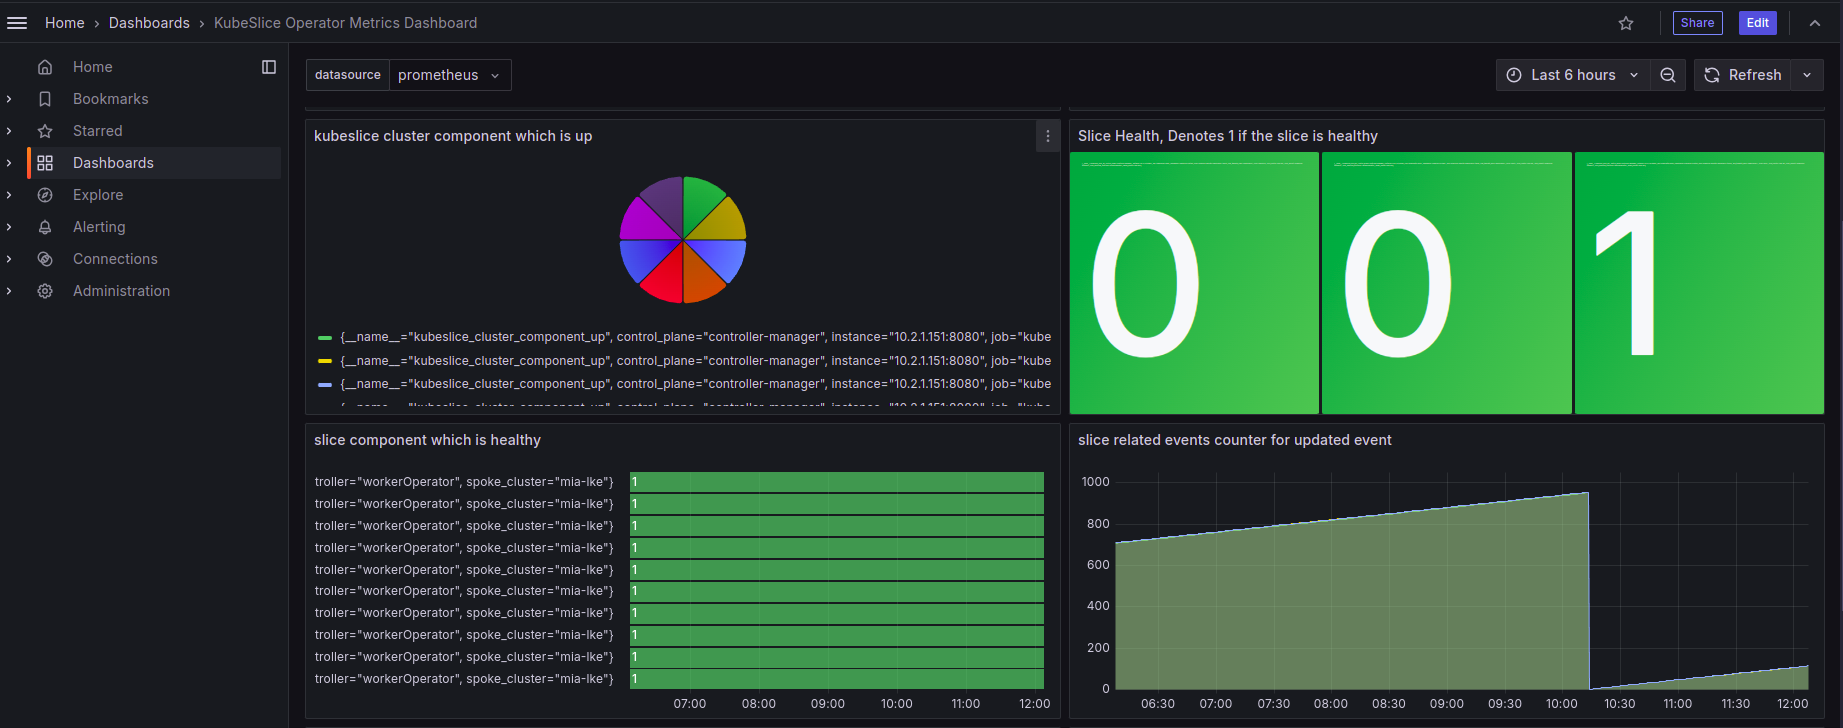
The following figure shows the Slice Operator metrics on a Grafana dashboard.