View Cost Allocation
This topic describes the cost management feature that allows you to assess the total resource cost per slice through the KubeSlice Manager. KubeTally is another name for cost management.
Using the KubeSlice Manager, view the cost allocations for each service, ingress Load Balancer, and node reservation. Also, export the daily and monthly cost reports in CSV format.
Overview
This feature enables you to track the resource usage and the cost associated with it at the slice level. The resource utilization and the total cost will be shown for a service in the KubeSlice Manager. There can be multiple services within a namespace of a cluster. Also, there can be multiple clusters within a slice. The cost will be shown for each services under all namespaces and all clusters connected to the slice.
The current version of KubeTally only supports AWS and Akamai cloud clusters. You can view cost allocation only for AWS and Akamai cloud clusters.
View the Cost
To view the resource cost:
-
Go to Cost Management on the left sidebar.
-
On the Slices page, select the slice to get the per slice information. For example, select the tech slice to view the slice information.
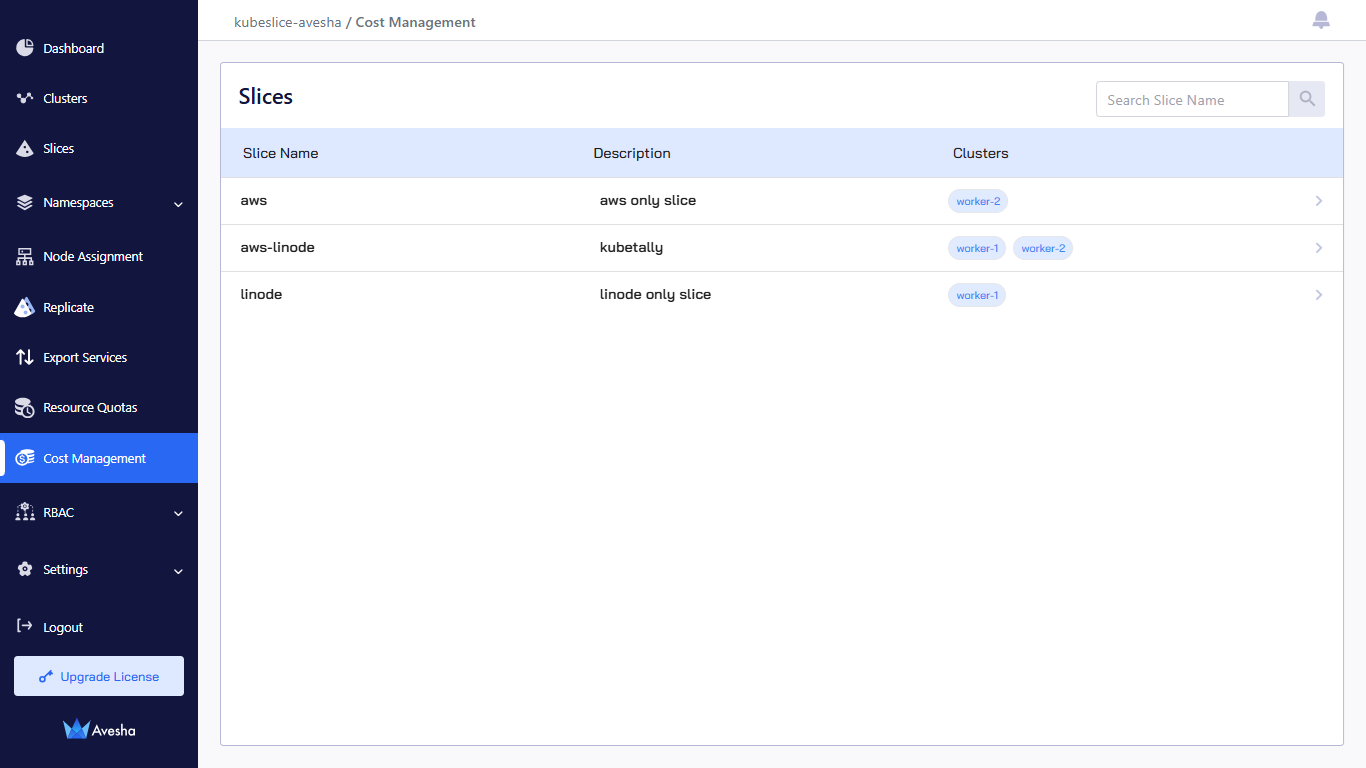
The following figure shows the list of services for each cluster, and the total cost for the tech slice on the top right corner. The default view is
Monthly, which shows the current month cost. Switch toDailyview to see the daily cost details.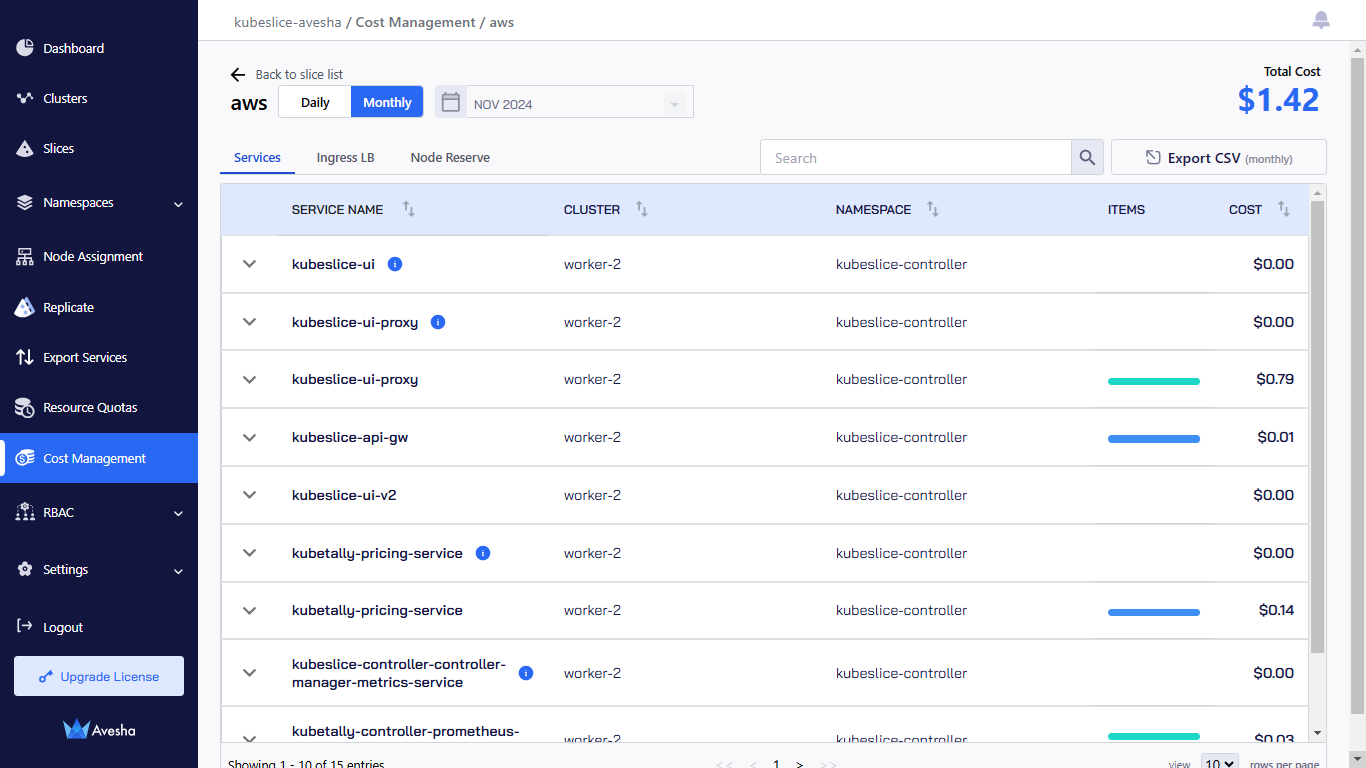
-
On the selected slice page, you see the Services , Ingress LB, and Node Reserve tabs.
-
On the Services tab, under the SERVICE NAME, view the cost and usage associated with all the services. Select the service to view the cost allocation. For example, for a namespace, view the Usage in millicore hours for compute pods and in GB hours for storage. Additionally, you can see the Time in use in hours, and the Price in USD for compute, PersistentVolume, and LoadBalancer items.
-
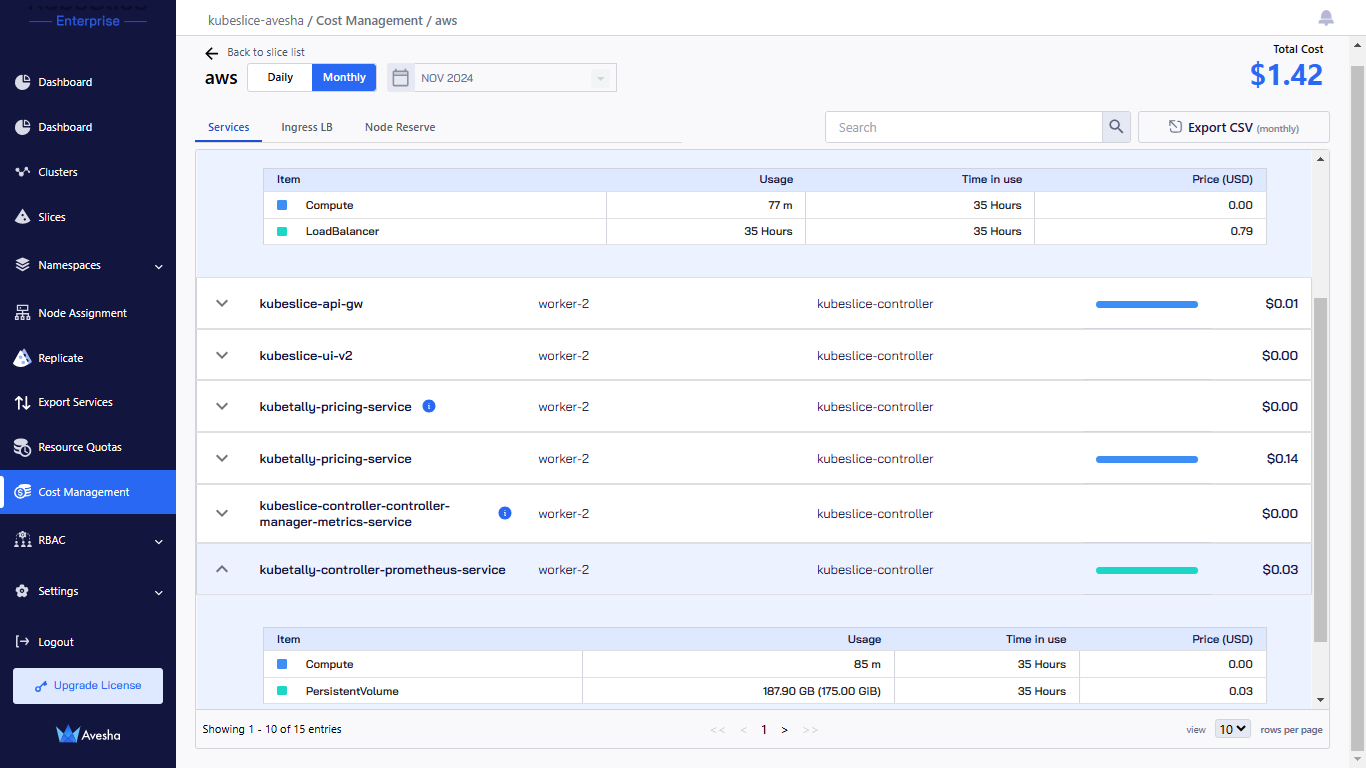
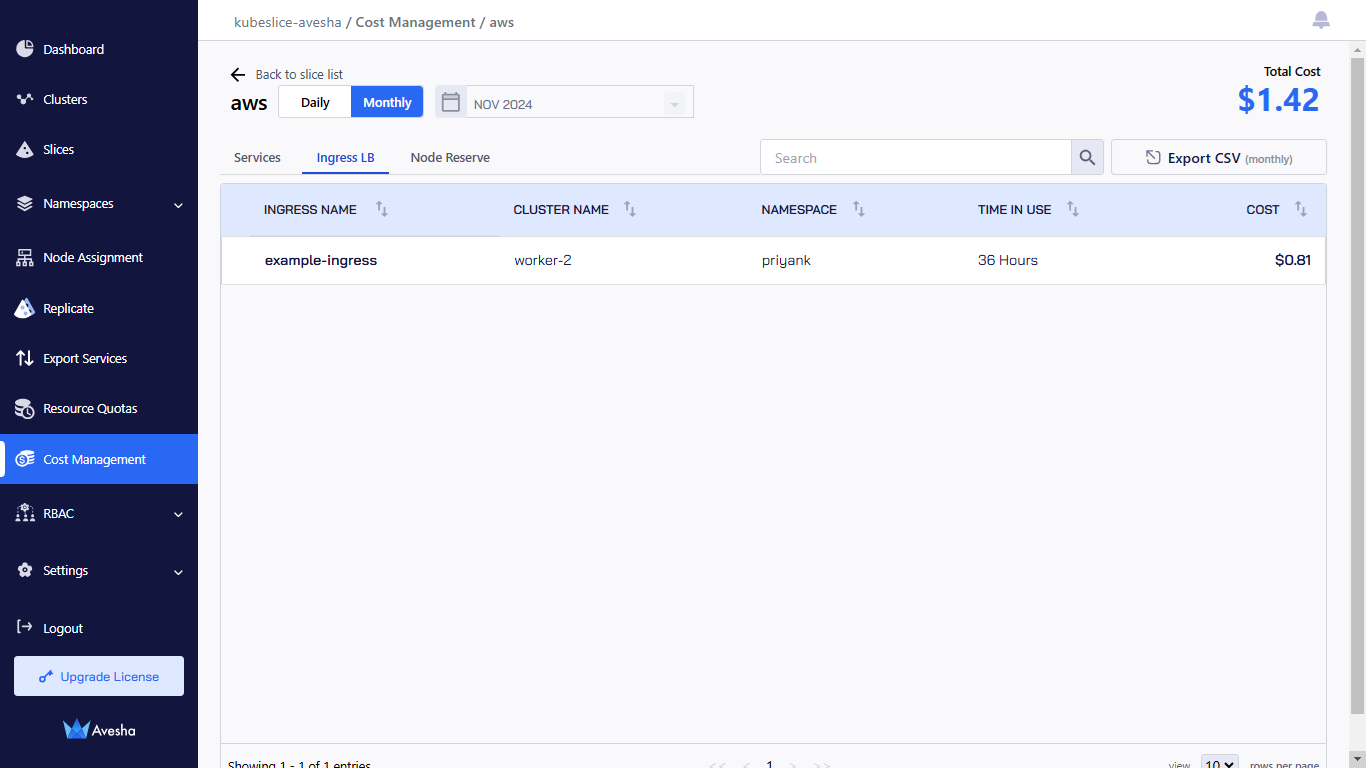
On the Ingress LB tab, under the INGRESS NAME, view the cost associated with the Ingress Load Balancer for a cluster.
-
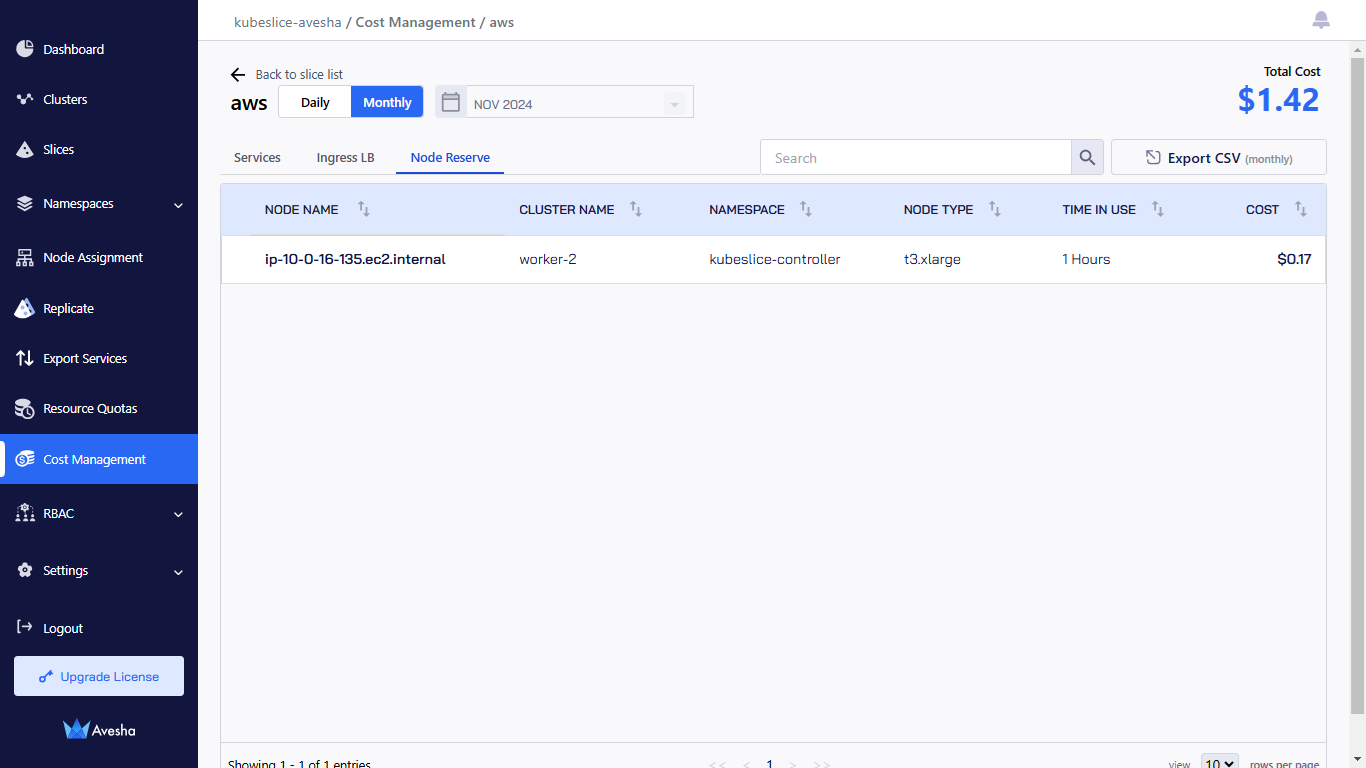
On the Node Reserve tab, under the NODE NAME, view the cost associated with the node resource.
-
Generate the Report
To produce the daily or monthly report per slice in CSV format, select the Daily or Monthly view from the top-left corner, and click the Export CSV button. Save the file to your local system.
The resource cost report per slice includes the following columns:
- start timestamp (UTC): The start of the time range requested by the user.
- end timestamp (UTC): The end of the time range requested by the user.
- slice_name: The slice from which the metrics are generated.
- cluster_name: The cluster from which the metrics are generated.
- name_space: The Kubernetes namespace from which the metrics are generated.
- service_name: The Kubernetes service from which the metrics are generated.
- is_reserved: The value is
TRUEonly for the services listed in the Services tab that are deployed in the reserved node. - millicores_used: The sum of the highest millicore hours usage across the time range requested by the user. For compute pods, millicore hours are represented by usage.
- node_name: The Kubernetes node name from which the metric is generated.
- node_type: The type of node from which the metric is generated. For example, for AWS, it can be
t3.large. - node_cost: The price per hour for the node type from which the metric is generated.
- cost: The total resource cost in US dollars for the requested time range.
- price: This is the price per CPU per hour in US dollars.