Access the Obliq AI SRE Agent Console
After installing agents, access the Obliq AI SRE Agent console using your virtual machine's IP address and the port 80. For information on how to obtain the load balancer IP address, see Method to Access the Agent Console.
The access URL for the console is <Load balancer/Node Port IP address>:80.
Create an Account
-
Go to the access URL on a web browser.
-
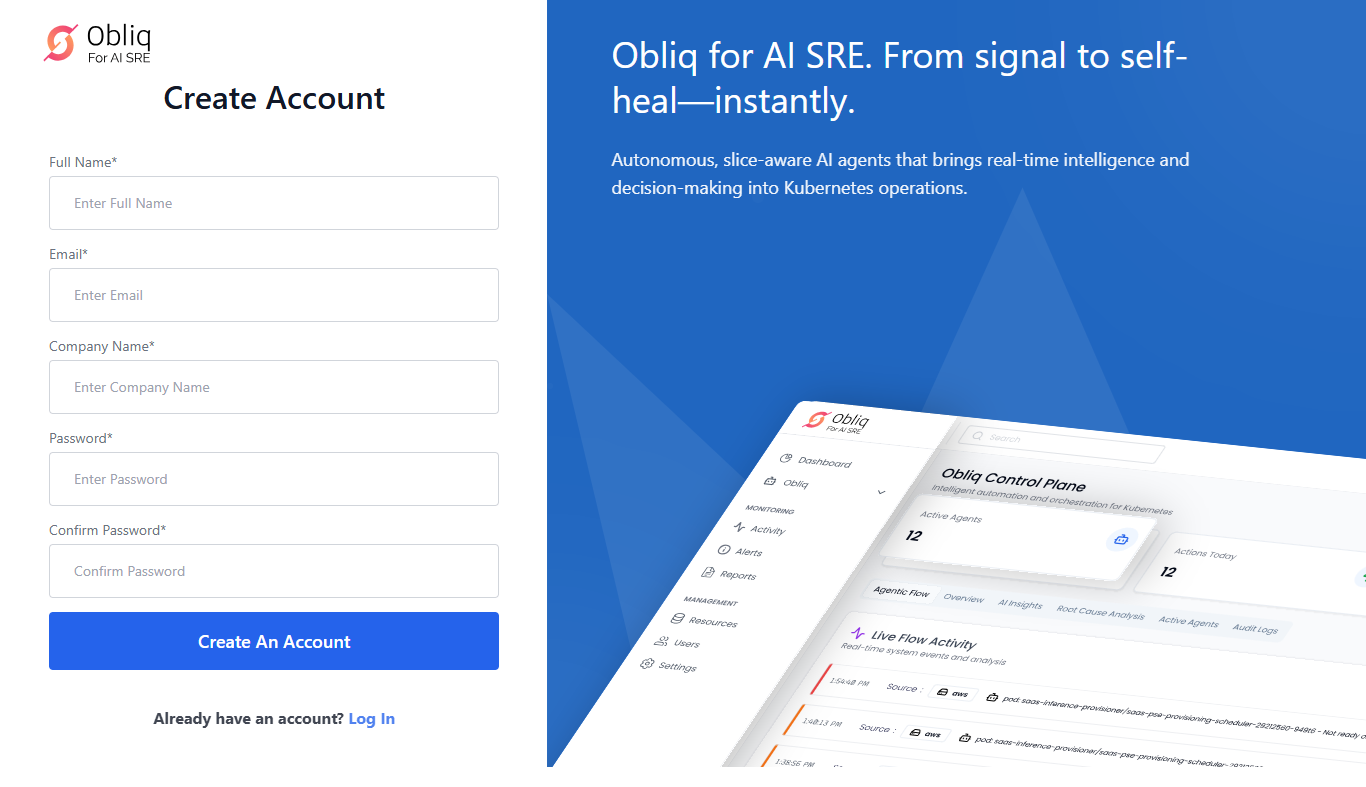
As a first-time user, you must create an account. Click Create an account on the access webpage.
-
To create an account:
- Enter your complete name in the Full Name text box.
- Enter your email address in the Email text box.
- Enter your company/organization name in the Company Name text box.
- Enter a new password for your account in the Password text box.
- Confirm the new password in the Confirm Password text box.
- Create an Account.
-
Your account is created successfully and you are redirected to the login page.
-
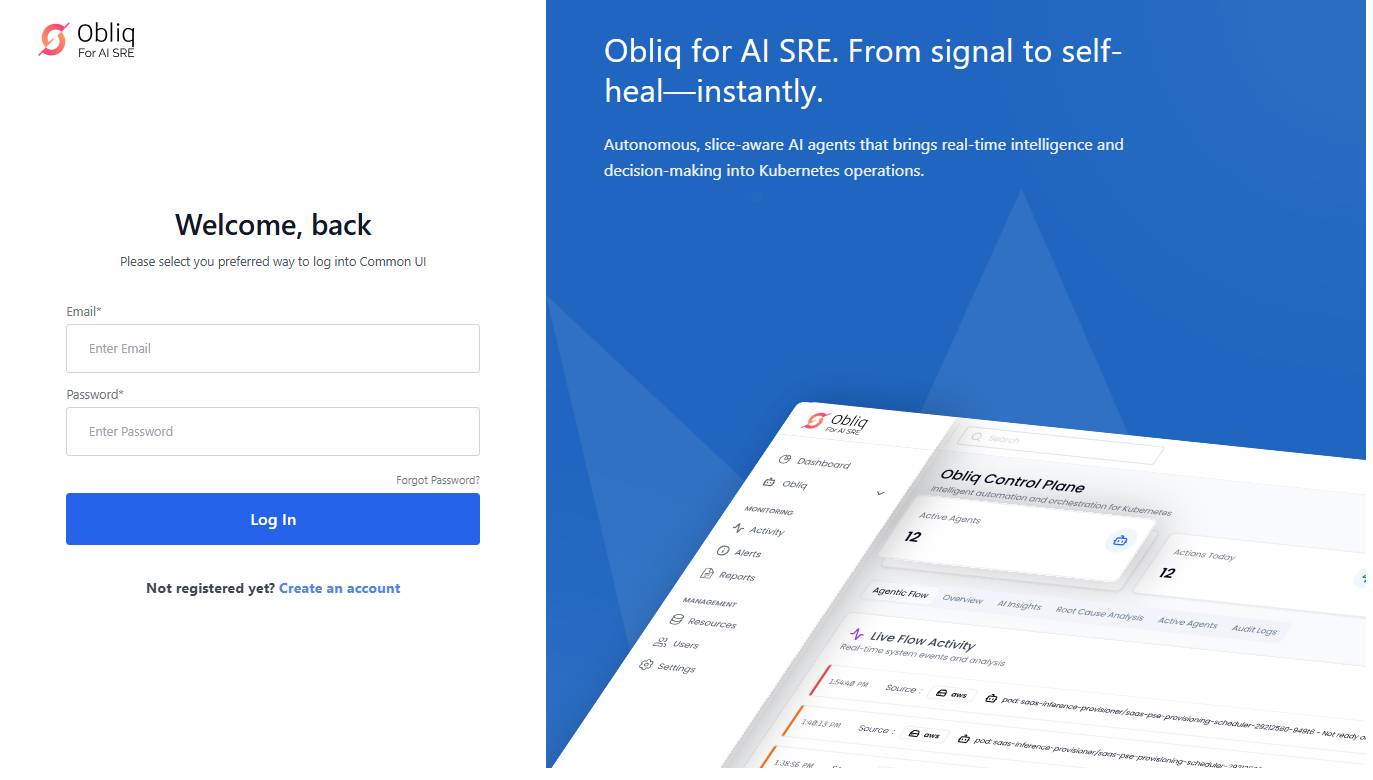
Enter your login credentials to access the Obliq AI SRE Agent console.
Log in to the Console
-
Go the
<access URL>/login page. -
Enter your login credentials to access the Obliq AI SRE Agent console.
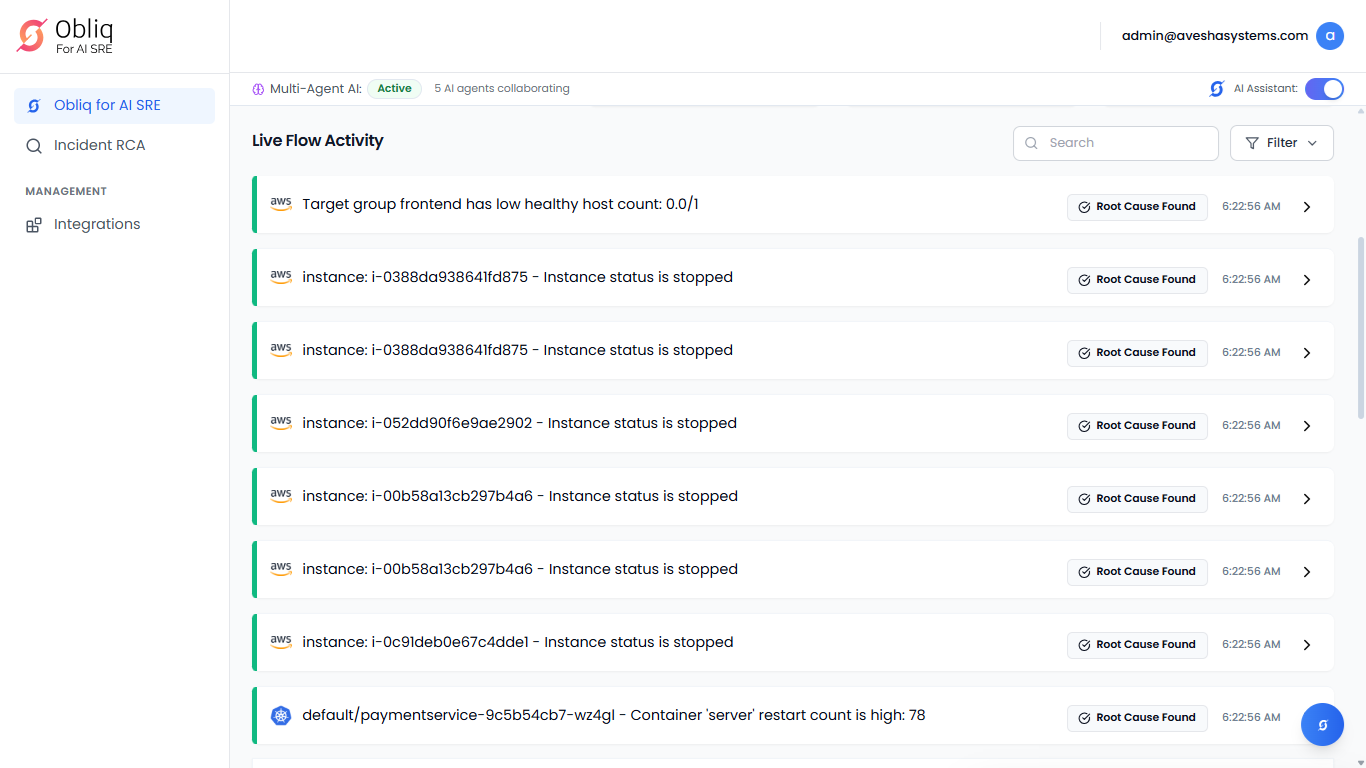
Monitor the Obliq Control Plane
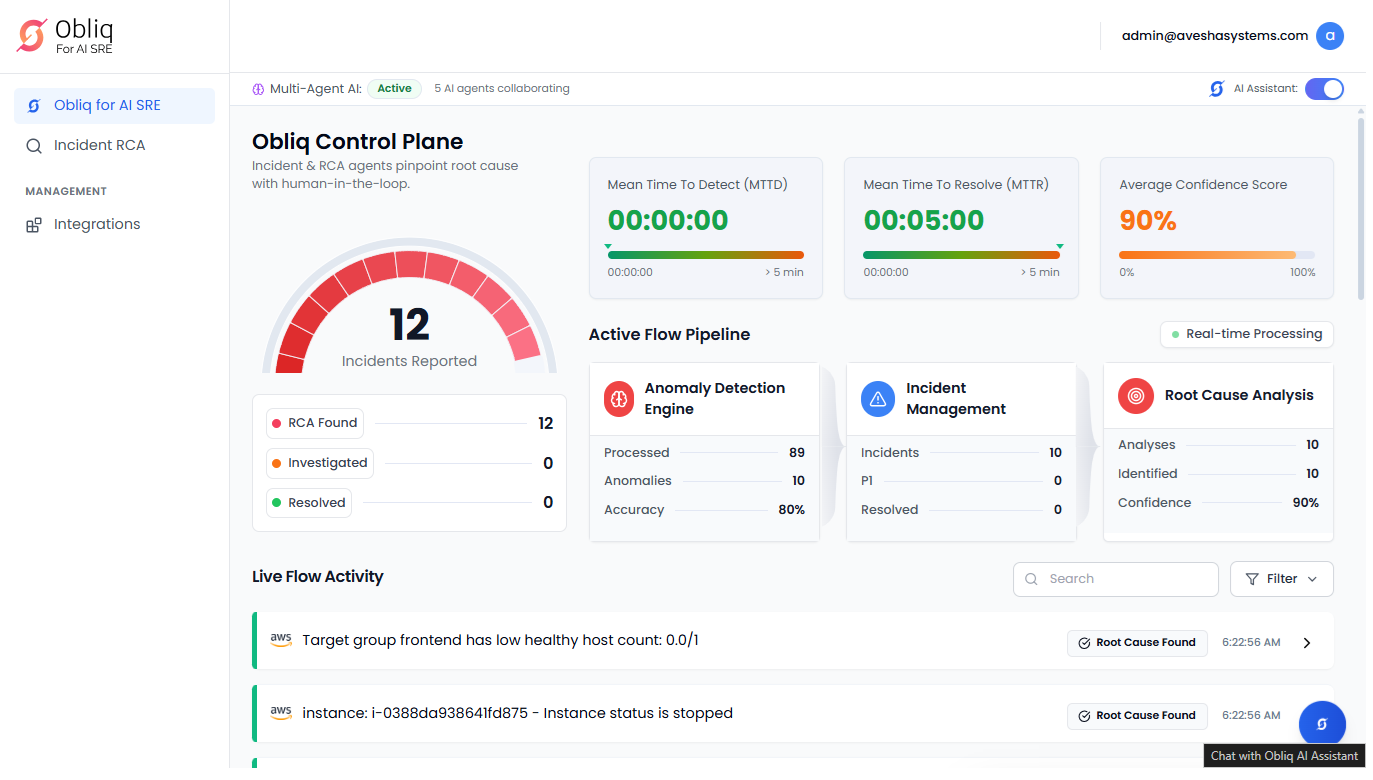
After you logged in to the console, you land into the control plane.
Currently, the AI SRE Agent only supports Jira tracking tool.
To monitor:
-
Monitor active agents, success rate, and issues resolved, and flow configuration on the top of the control plane.
-
Scroll down to monitor the live flow activity.
-
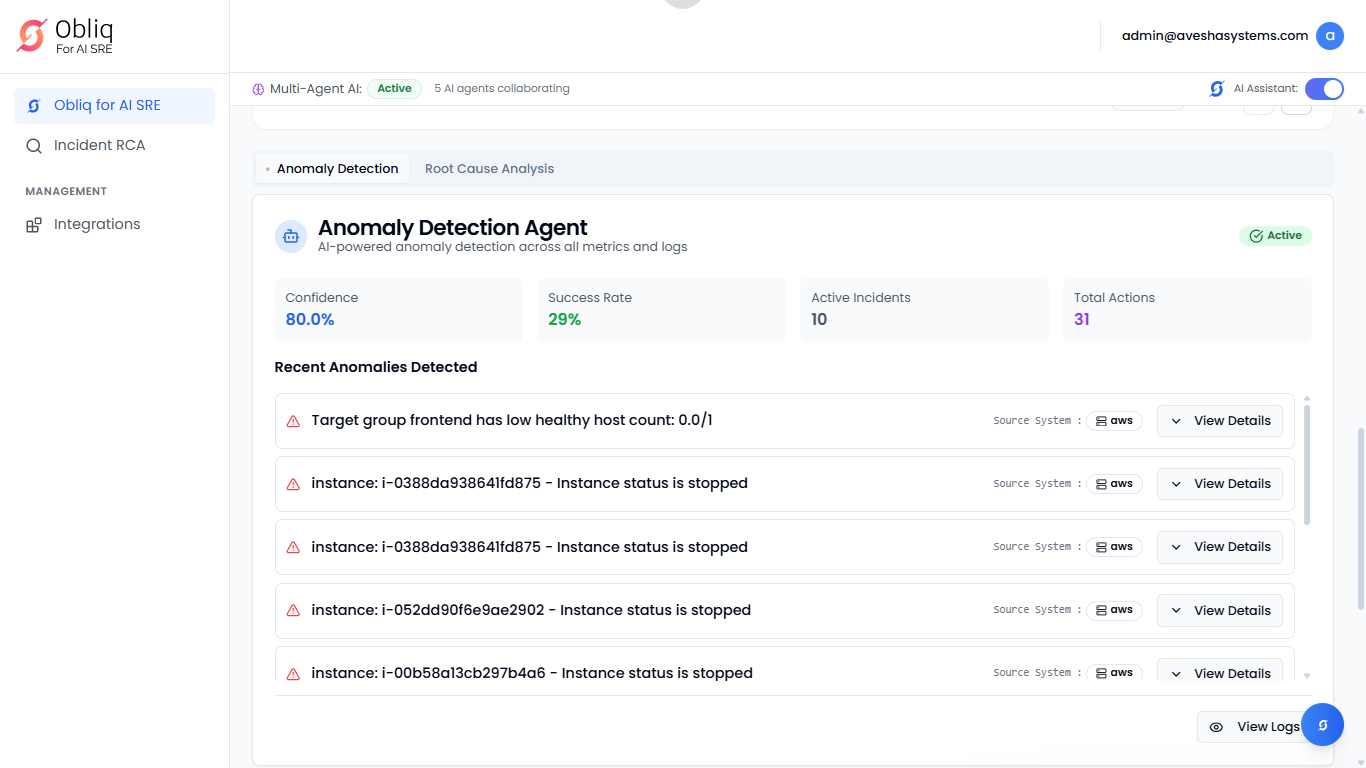
Scroll down further to monitor anomaly detection. Go to the Incident Management tab to track incidents.
-
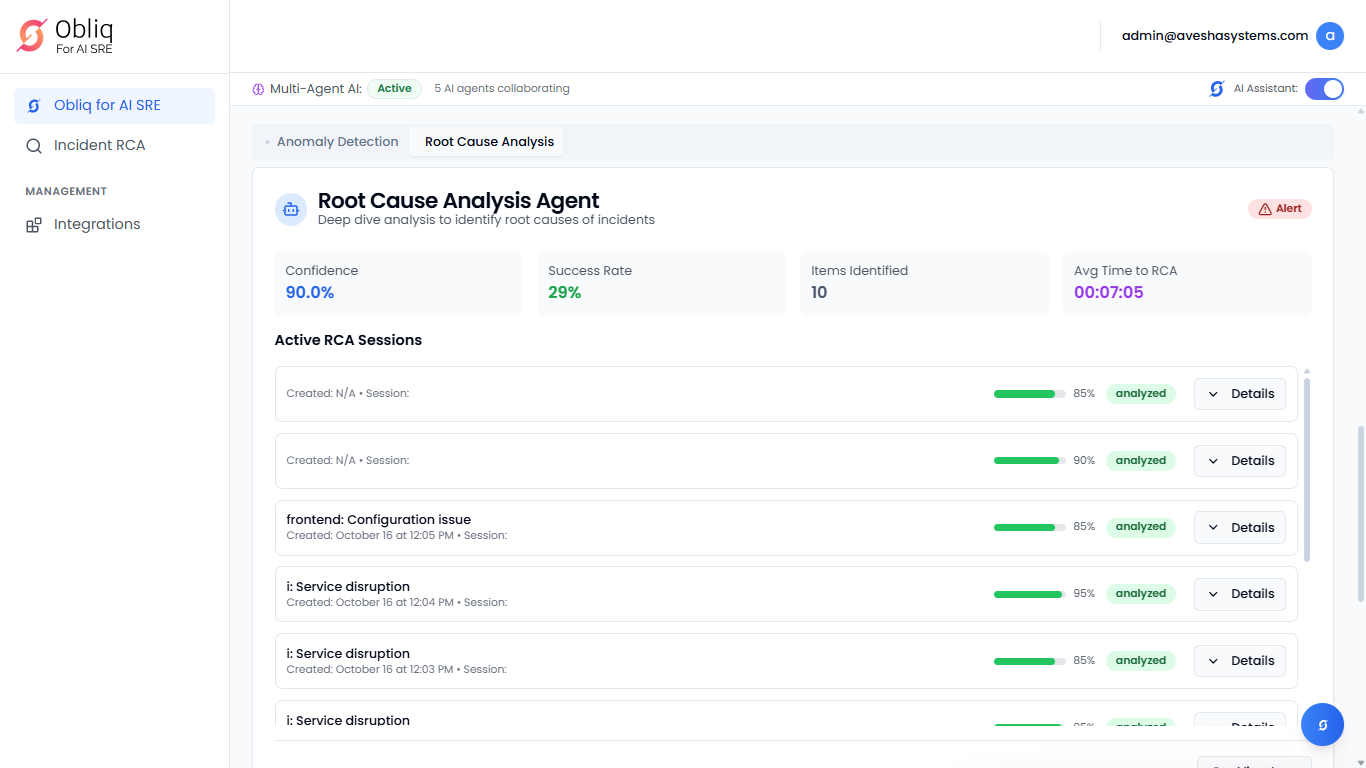
Go to the Root Cause Analysis tab to monitor the Root Cause Analysis Agent.
-
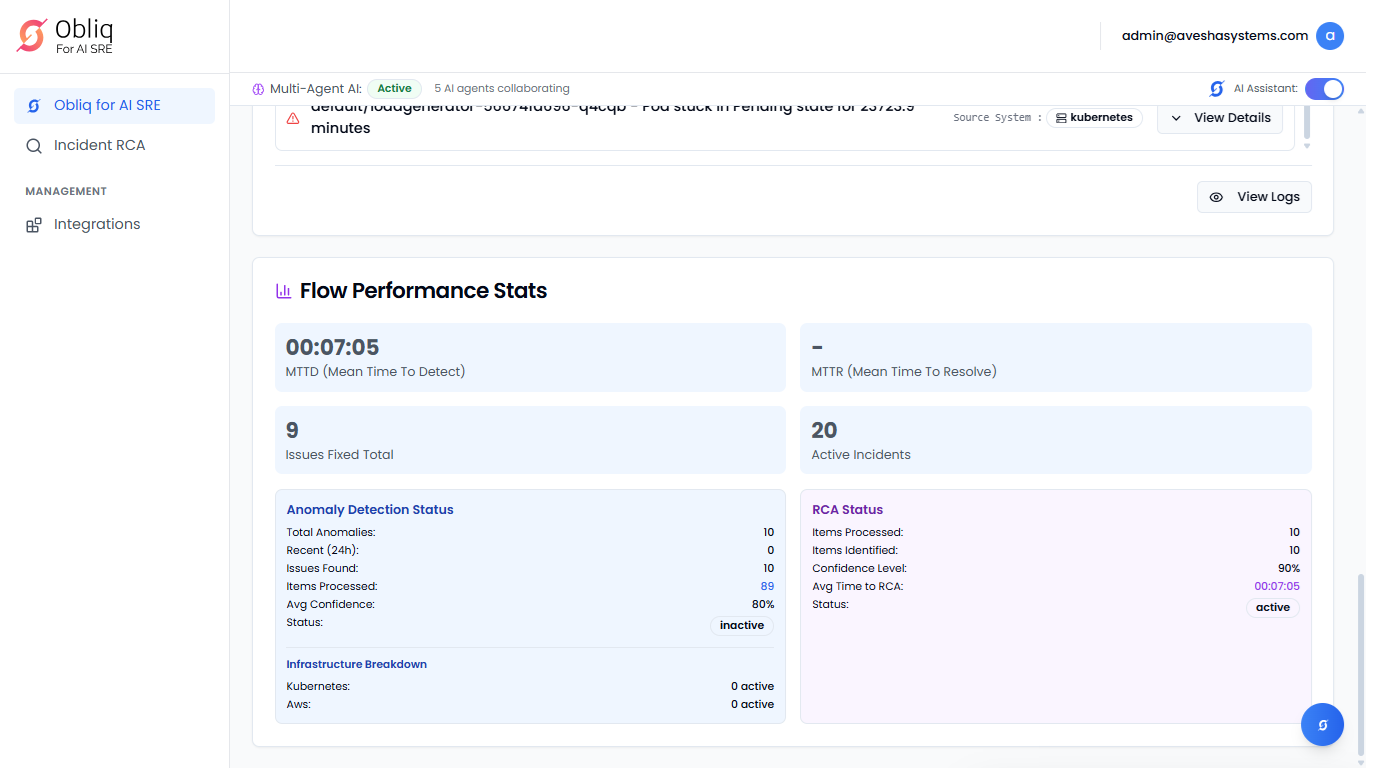
Scroll down again to monitor the flow performance that provides the performance status.