Monitor the Dashboard
The dashboard page provides admins an aggregated live view of all GPU related information at a glance. An admin can use the dashboard to monitor key metrics related to the GPU pool. The key metrics include GPRs, GPU utilizations, allocations, errors, power, and temperature usage of the GPUs.
The dashboard contains the following tabs:
- Overview
- Cost Analysis
Monitor the Dashboard Overview
Overview is the default tab on the Dashboard landing page. You can narrow monitoring by using the Cluster, Workspace, and GPU Shape filters.
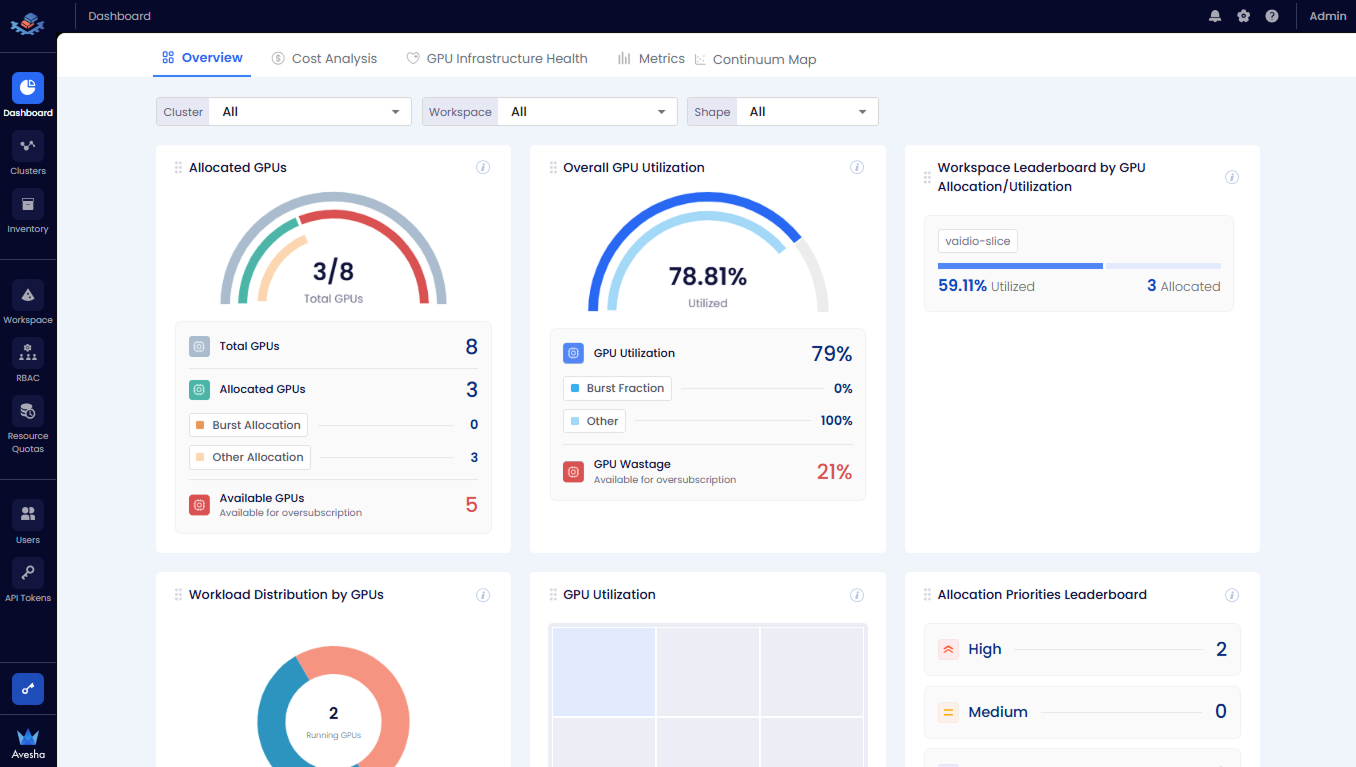
- Allocated GPUs: A breakdown of total number of GPUs, allocated GPUs, and available GPUs.
- Overall GPU Utilization: The GPU utilization and wastage in percentage.
- Workspace Leaderboard by GPU Allocation or Utilization: The GPU allocation and utilization aggregated by workspace.
Scroll towards the bottom of the dashboard to see the following tiles:
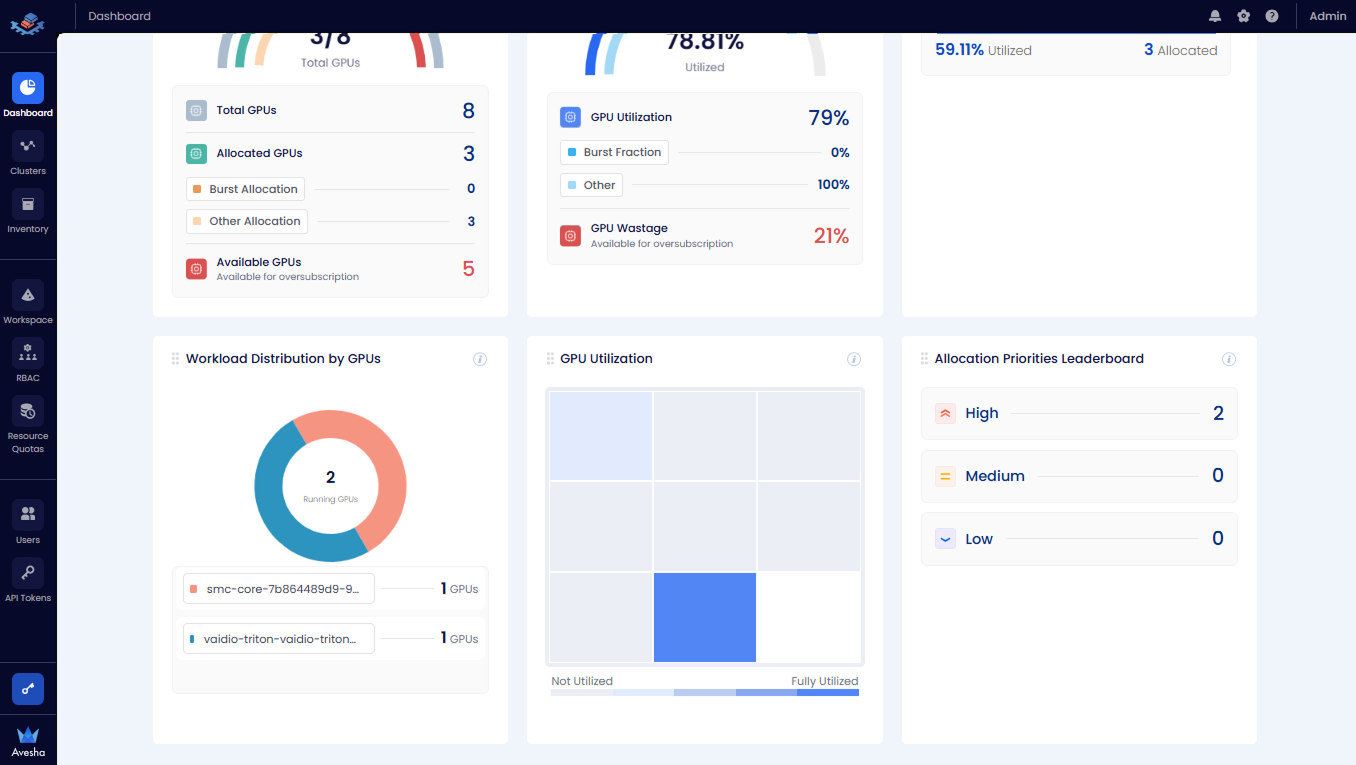
- Workload Distribution by GPUs: The GPUs distributed per workload.
- GPU Utilization: The GPU utilization visualized in a treemap.
- Allocation Priorities Leaderboard: The GPU allocation categorized by priorities.
Analyze the GPU Cost
To analyze the GPU cost, go to Cost Analysis on the Dashboard page. You can narrow the cost analysis by using the Cluster, Workspace, GPU Shape, and GPR filters.
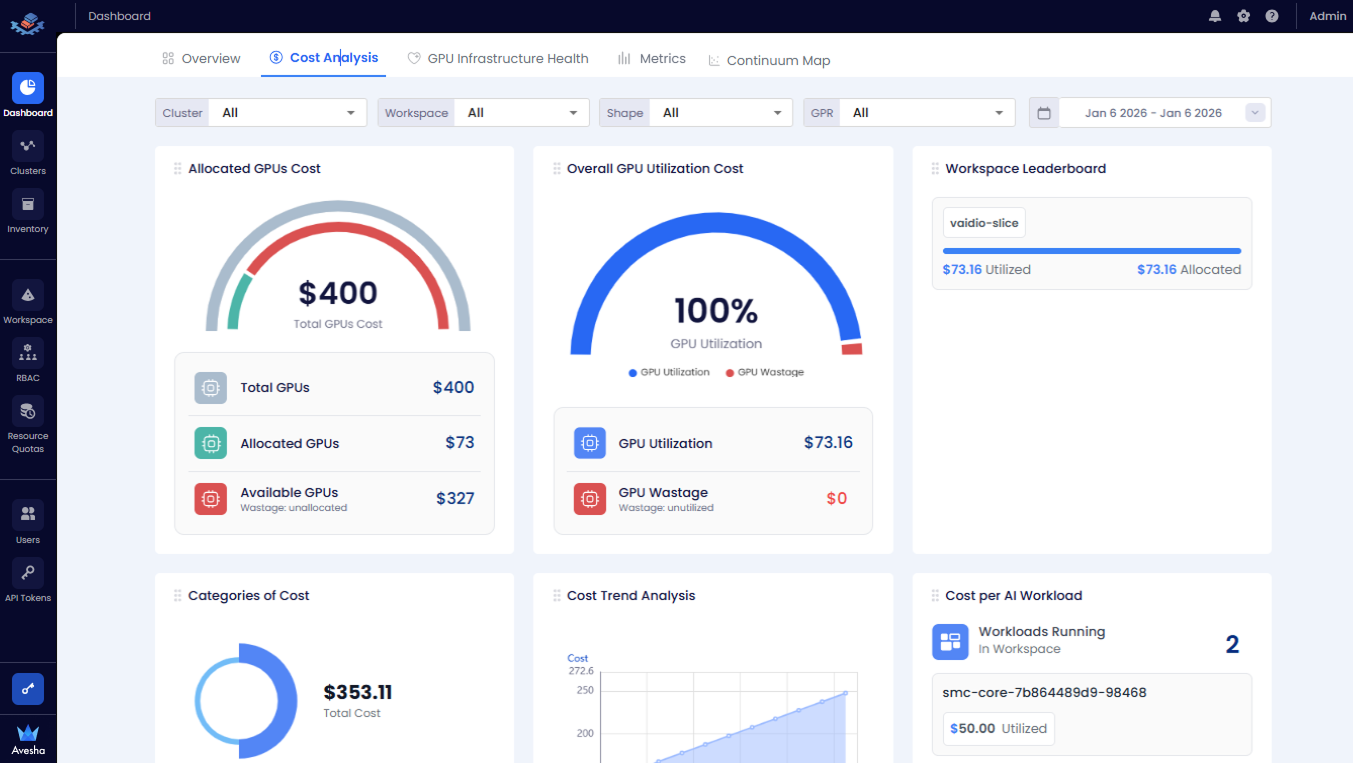
Analyze the cost from the following tiles:
- Allocated GPUs Cost: The GPUs cost.
- Overall GPU Utilization Cost: The GPU utilization cost and wastage cost.
- Workspace Leaderboard: The utilization and allocated cost aggregated by workspace.
Scroll towards the bottom of the dashboard page to see the following tiles:
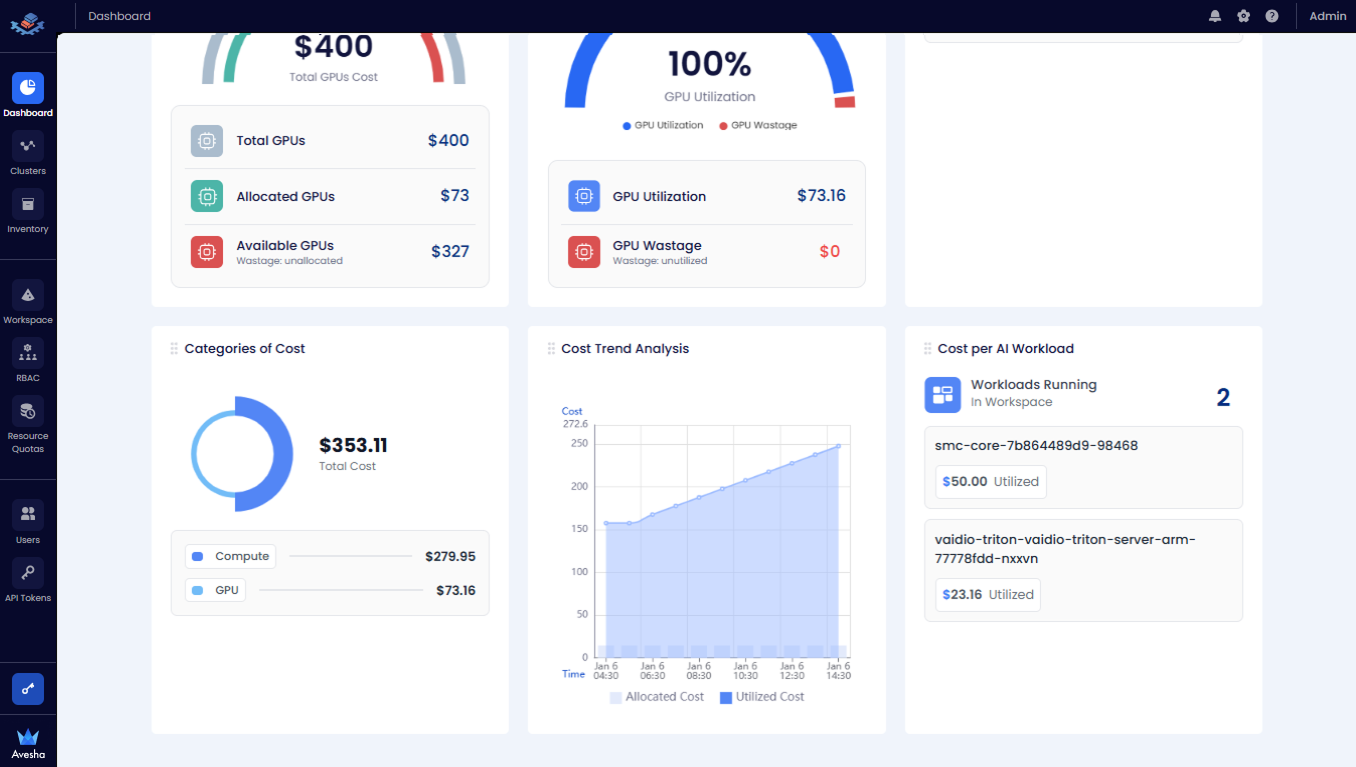
- Categories of Cost: The utilization cost aggregated by node components.
- Cost Trend Analysis: The chart representation of the allocated cost versus utilized cost.
- Cost per AI Workload: The utilization cost per AI workload.
Monitor the GPU Infrastructure Health
To monitor the GPU infrastructure health, go to GPU Health Infrastructure on the Dashboard page. You can narrow monitoring by using the Cluster, Workspace, and GPU Shape filters.

Monitor the cost from the following tiles:
- GPU Power Usage: The maximum power usage in Watt per each GPU during the selected time period.
- Power Usage Trend Analysis: The hourly power usage trend per each GPU. You can choose the GPU Node from the drop-down list to analyze its GPUs' power usage.
- Jobs per dollar per watt: The list of jobs/workloads with the associated US Dollar per Watt cost. The value is calculated by GPU Hourly Cost/Average Workload Power Usage.
Scroll towards the bottom of the dashboard page to see the following tiles:
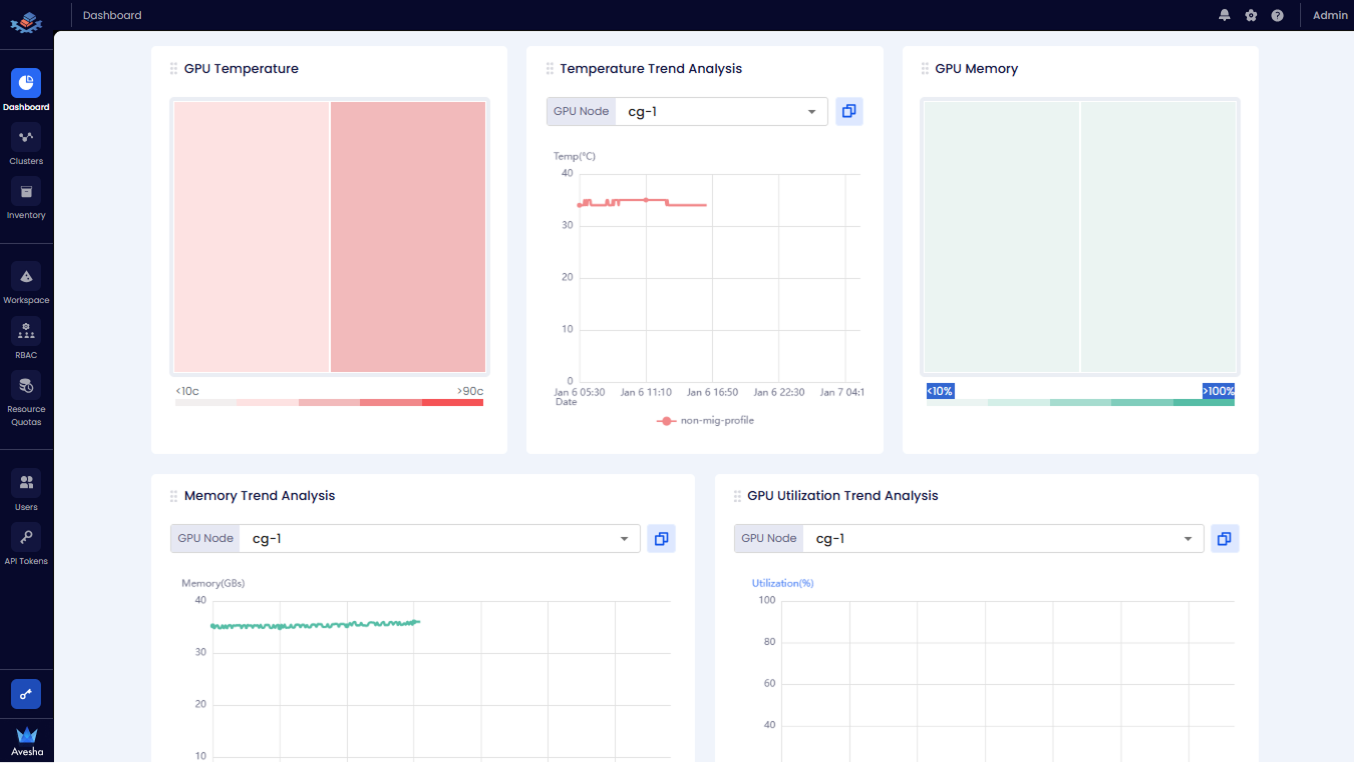
- GPU Temperature: The maximum temperature per each GPU during the selected time period.
- Temperature Trend Analysis: The hourly temperature trend per each GPU. You can choose the GPU Node from the drop-down list to analyze its GPUs' temperature.
- GPU Memory: The maximum memory usage per each GPU.
- Memory Trend Analysis: The hourly memory usage trend per each GPU. You can choose the GPU Node from the drop-down list to analyze its GPUs' memory usage.
- GPU Utilization Trend Analysis: The hourly GPU utilization trend per each GPU. You can choose the GPU Node from the drop-down list to analyze its GPUs' utilization.
View the Network Latency Metrics
The Metrics tab on the Dashboard page shows the status, resource usage, and network latency metrics for all worker clusters in the workspace.
The diagram below displays the workspace’s multi-cluster network latency map, highlighting round-trip latency between clusters.
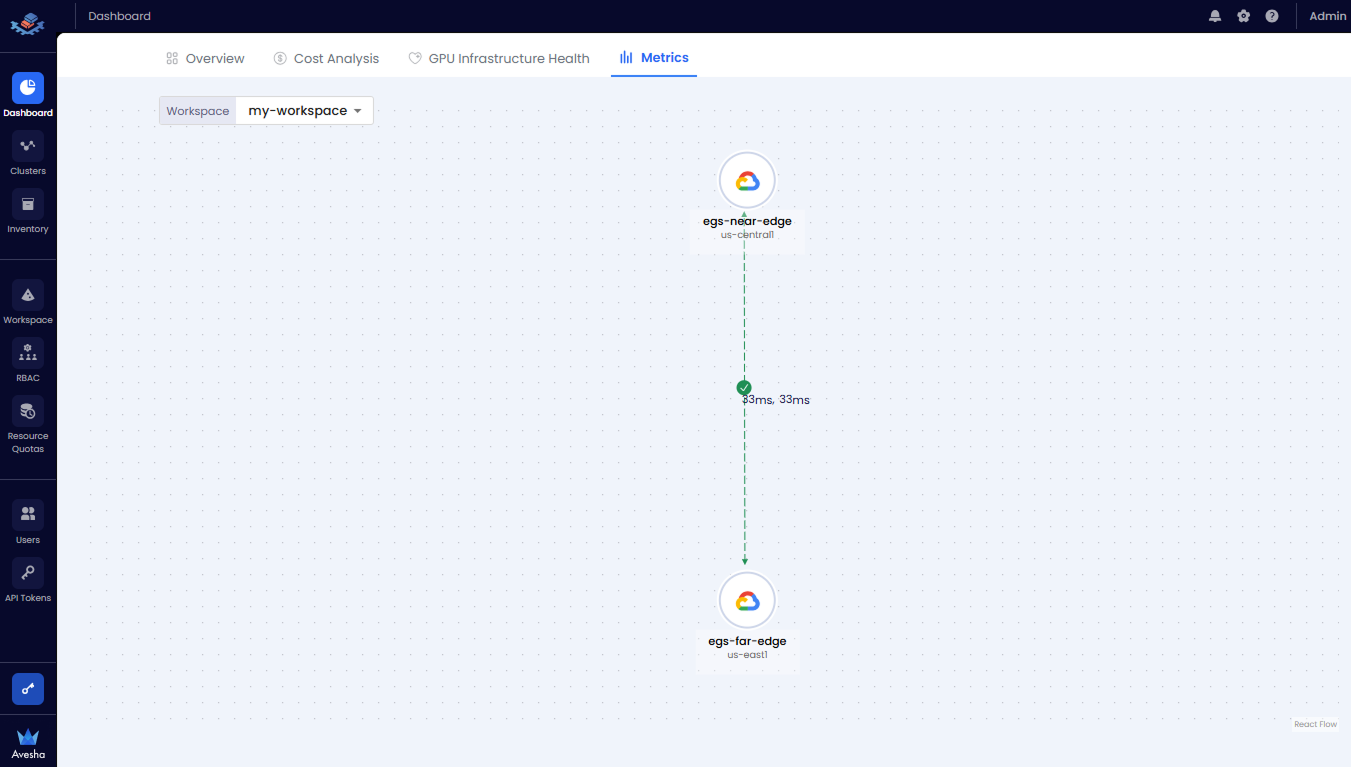
For example, the three worker clusters, worker-1, worker-2, and worker-3 are part of a metric-slice workspace. All located in us-east1
region are displayed in the topology map with latency information between the clusters. A Legend on the left lists available
infrastructure providers.
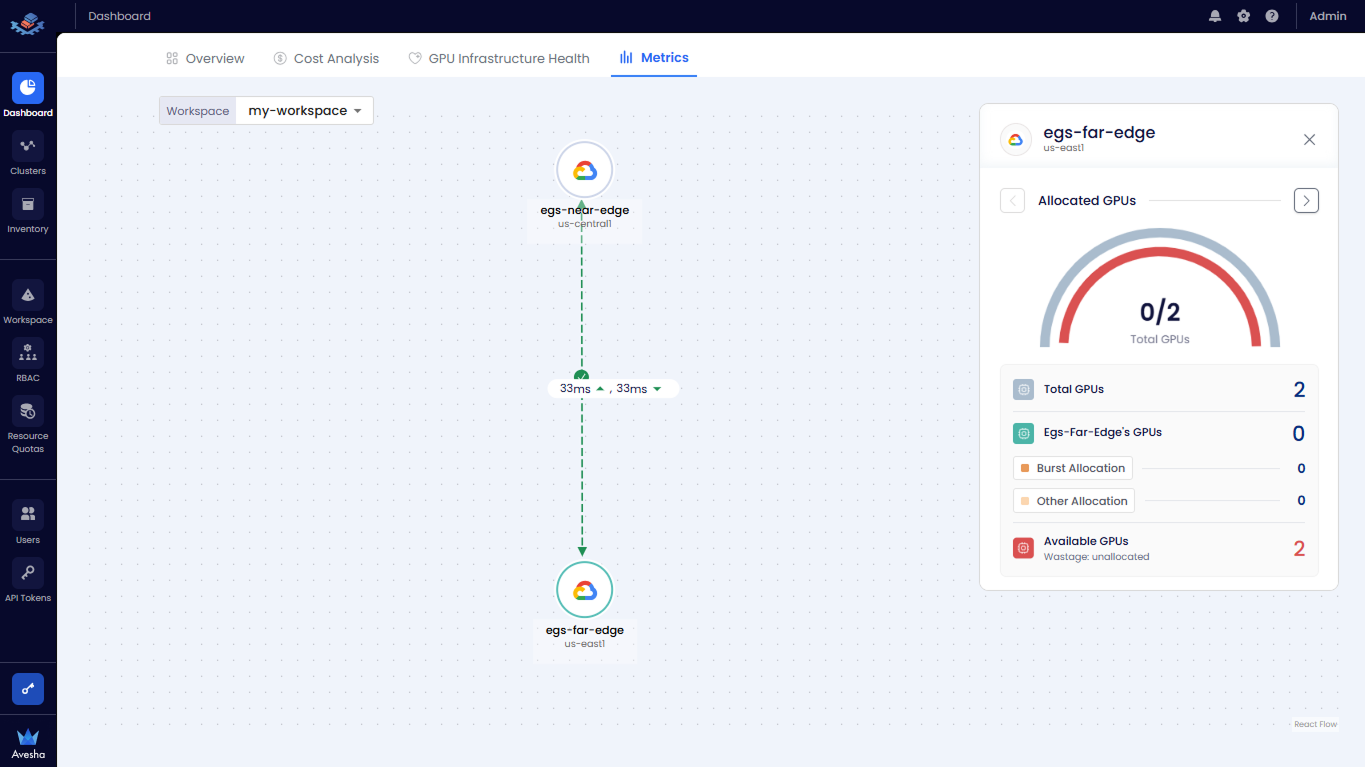
You can select the worker cluster on the topology map to view its inventory details, including Total GPUs, Allocated GPUs, and Available GPUs.
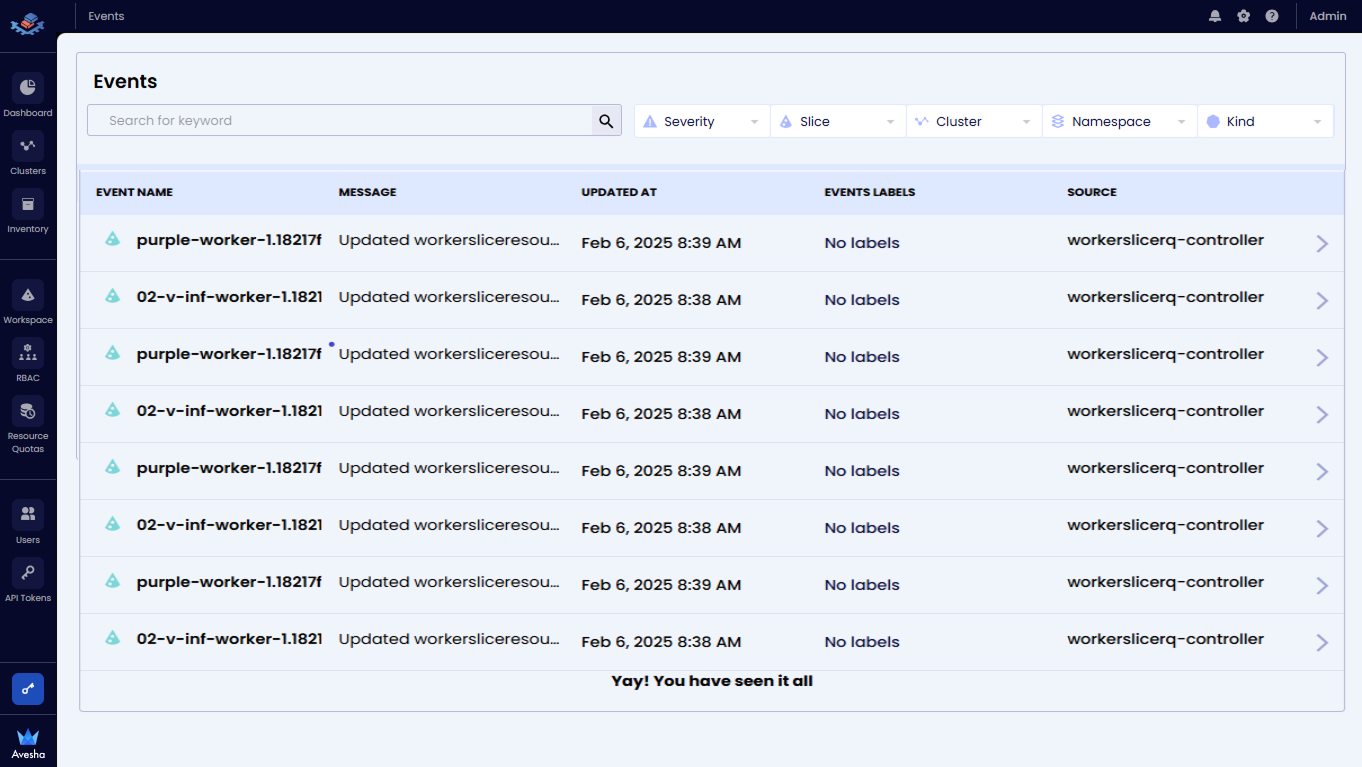
View Events
On any page of the EGS Admin platform, you can see the event notifications.
To view the events:
-
Click the bell icon at the top-right corner of any page on the Admin Portal.
-
The Events page lists all the GPR events.
Add the Continuum Map
You can add the Continuum Map to the Dashboard page to visualize the distribution of GPU resources across different tiers of the edge-to-cloud continuum. You associate clusters to a tier by linking them to a Continuum Map. This allows you to monitor GPU resource allocation and utilization across the continuum. View how workloads are distributed across tiers, helping optimize resource usage and performance. View real-time metrics for each tier, including total GPUs, allocated GPUs, available GPUs, and associated costs.
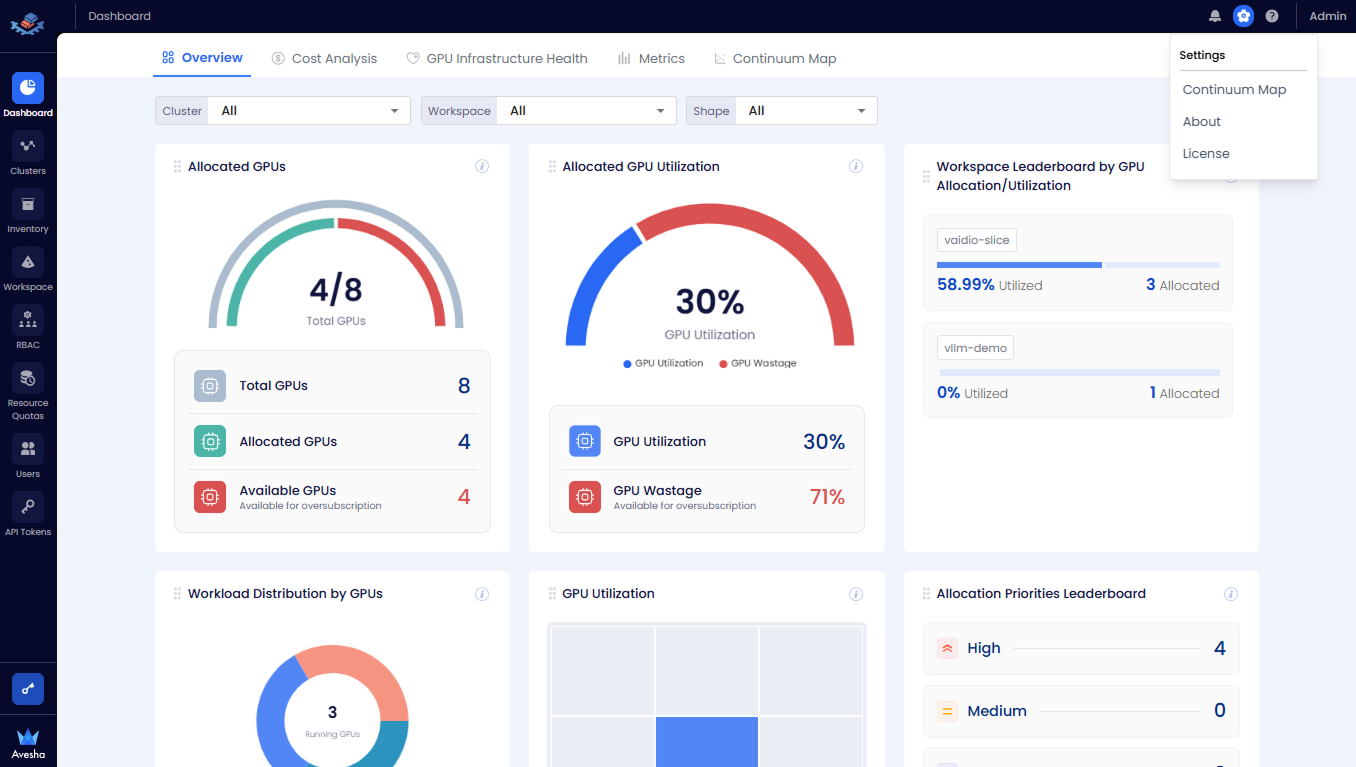
To add a Continuum Map to the dashboard:
-
Go to the Settings by clicking the gear icon at the top-right corner of the Admin Portal.
-
From the Settings menu, select Continuum Map.
-
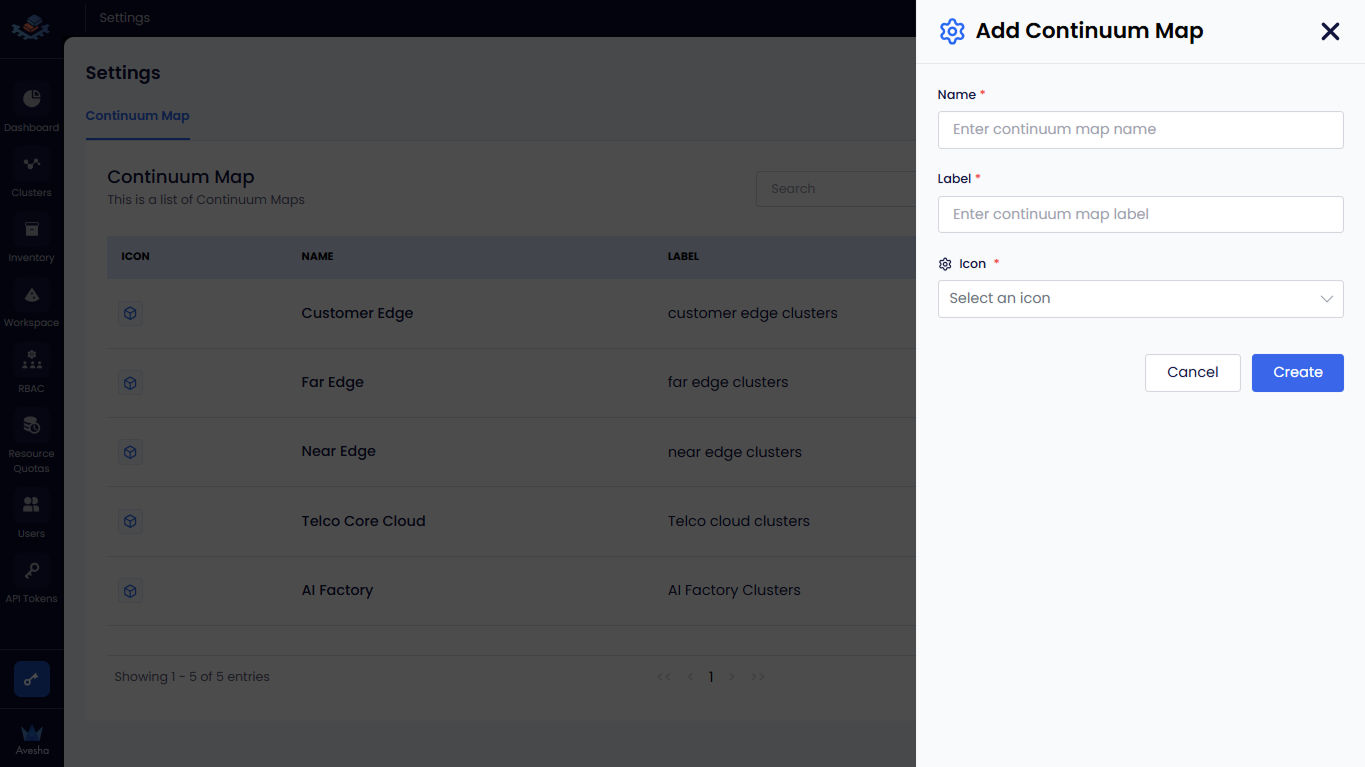
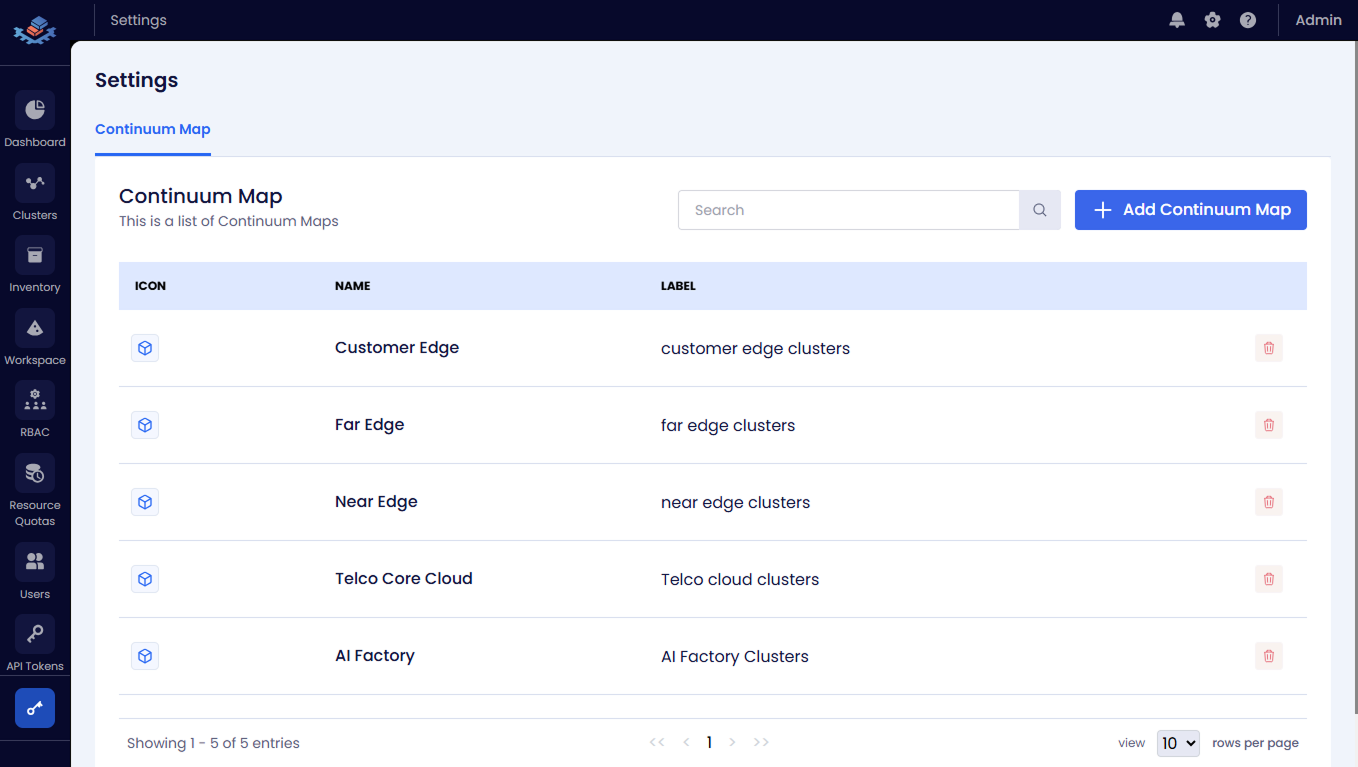
On the Continuum Map page, click the +Add Continuum Map button.
-
On the Add Continuum Map pane, enter the following details:
- Enter a name for the Continuum Map in the Name text box. For example,
Customer Edgeis the name of the tier. - Enter a label for the Continuum Map in the Label text box. For example,
Customer Edge clustersis the label. - Select an icon for the Continuum Map from the Icon drop-down list. For example, select the
mapicon.
- Enter a name for the Continuum Map in the Name text box. For example,
-
Click the Create button to add the Continuum Map to the Dashboard.
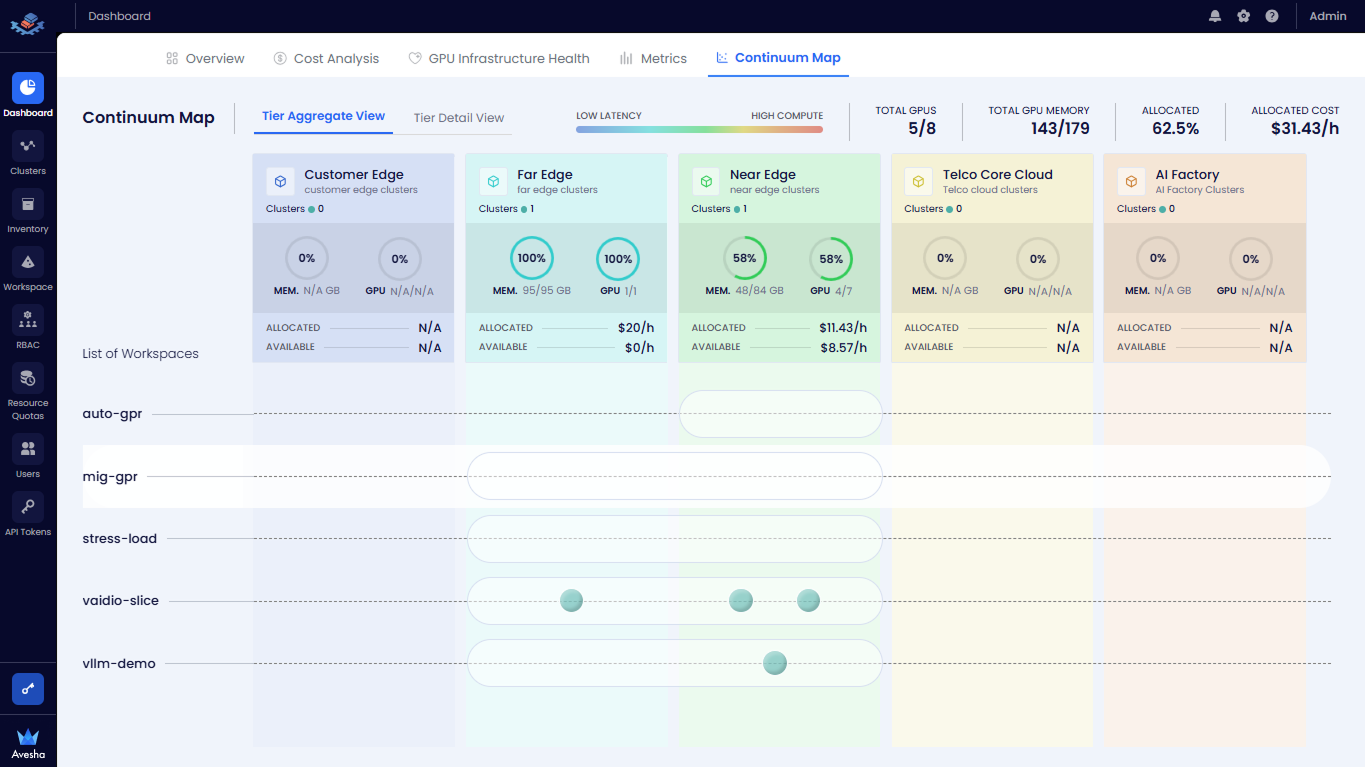
The following figure shows the added Continuum Map in the Continuum Map tab on the Dashboard page.
Associate Clusters to the Continuum Map
There are two options to associate clusters to the Continuum Map:
-
Associate a cluster to Continuum Map while registering the cluster with the EGS Controller. You can select the Continuum Map from the Continuum Map drop-down list while registering a cluster. For more information, see Register a Cluster.
-
Associate a cluster to Continuum Map after registering a cluster with the EGS Controller. You can edit the cluster settings to associate the cluster to Continuum Map. For more information, see Edit a Cluster.
Understand the Continuum Map
The Continuum Map tab on the Dashboard page shows map aggregated information of the GPU resources across different clusters by default.
You can view the detailed view of the map by clicking on the Tier Detailed View tab next to the Tier Aggregated View tab.
The Continuum Map page displays the following information:
- Tier Aggregated View: The aggregated view of all clusters in the tier. You can see the total number of GPUs, allocated GPUs, and available GPUs in the tier.
- Tier Detailed View: The detailed view of all clusters in the tier. You can see the total number of GPUs, allocated GPUs, and available GPUs in each cluster in the tier.
View Global Metrics
At the top-right of the Continuum Map, view the overall resource summary:
- Total GPUs: Displays the number of GPUs in use versus total GPUs available.
- Total GPU Memory: Shows allocated GPU memory versus total capacity.
- Allocated (%): Indicates the percentage of total GPU resources currently allocated.
- Allocated Cost: Displays the total hourly cost of allocated GPU resources.
Understand Tier Columns
The Continuum Map is divided horizontally into tiers from Low Latency to High Compute:
For example, the tiers include the following:
- Customer Edge
- Far Edge
- Near Edge
- Telco Core Cloud
- AI Factory
Each tier column represents a deployment zone and contains aggregate resource information. Each continuum map displays summary details for each tier.
Interpret Tier-Level Details
For each tier, view the following details:
- Clusters: Displays the number of clusters currently available in that tier.
- Memory Utilization: Shown as a circular indicator and numeric value (for example, 48/84 GB). Percentage reflects memory usage relative to total available memory.
- GPU Utilization: Shown as a circular indicator and numeric value (for example, 4/7 GPUs). Percentage reflects GPU usage in the tier.
- Allocated Cost: Displays the hourly cost of currently allocated GPU resources in that tier.
- Available Cost: Displays the hourly cost of unallocated GPU resources.
The N/A value indicates that no clusters or GPU resources are present in that tier.
View Workspaces
Below the tier summary, view the List of Workspaces section.
-
The leftmost column lists all workspaces available in Continuum Map.
-
Each row represents a workspace (for example,
auto-gpr,mig-gpr, andstress-load). -
Resource allocation is visualized using horizontal bars spanning across tiers.
-
Circular markers on the bars indicate where workloads for a workspace are currently placed along the continuum.
-
Circular markers on the bars indicates the GPU request status and the Workload Placement status for the workspace in that tier.
View Workload Distribution
To view the workload distribution for a specific workspace:
-
In the List of Workspaces section, locate the required workspace. For example, select the
auto-gprworkspace.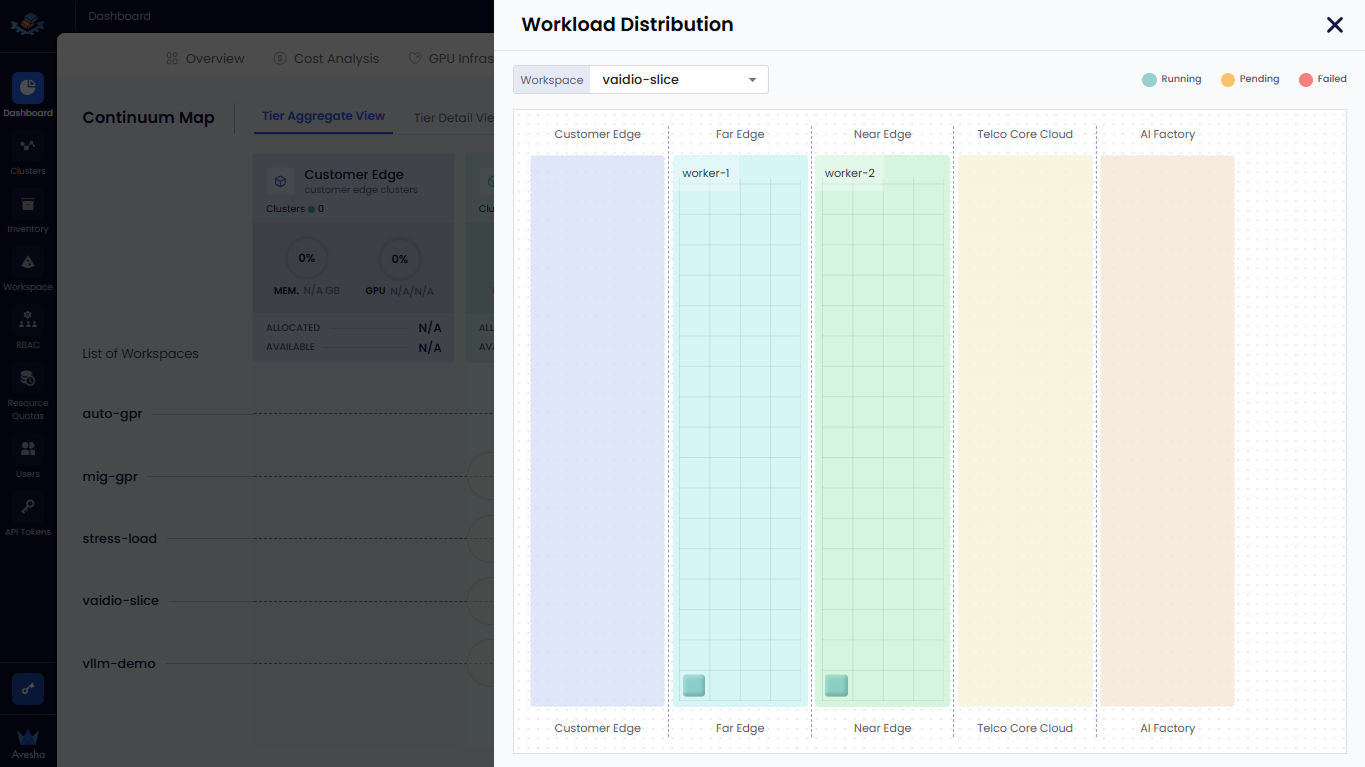
-
On the same row, view the horizontal bar spanning across tiers.
-
The circular markers on the bar indicate where workloads for that workspace are currently placed along the continuum.
-
Click the circular marker in any tier. For example, click the circular marker in the Customer Edge tier.
-
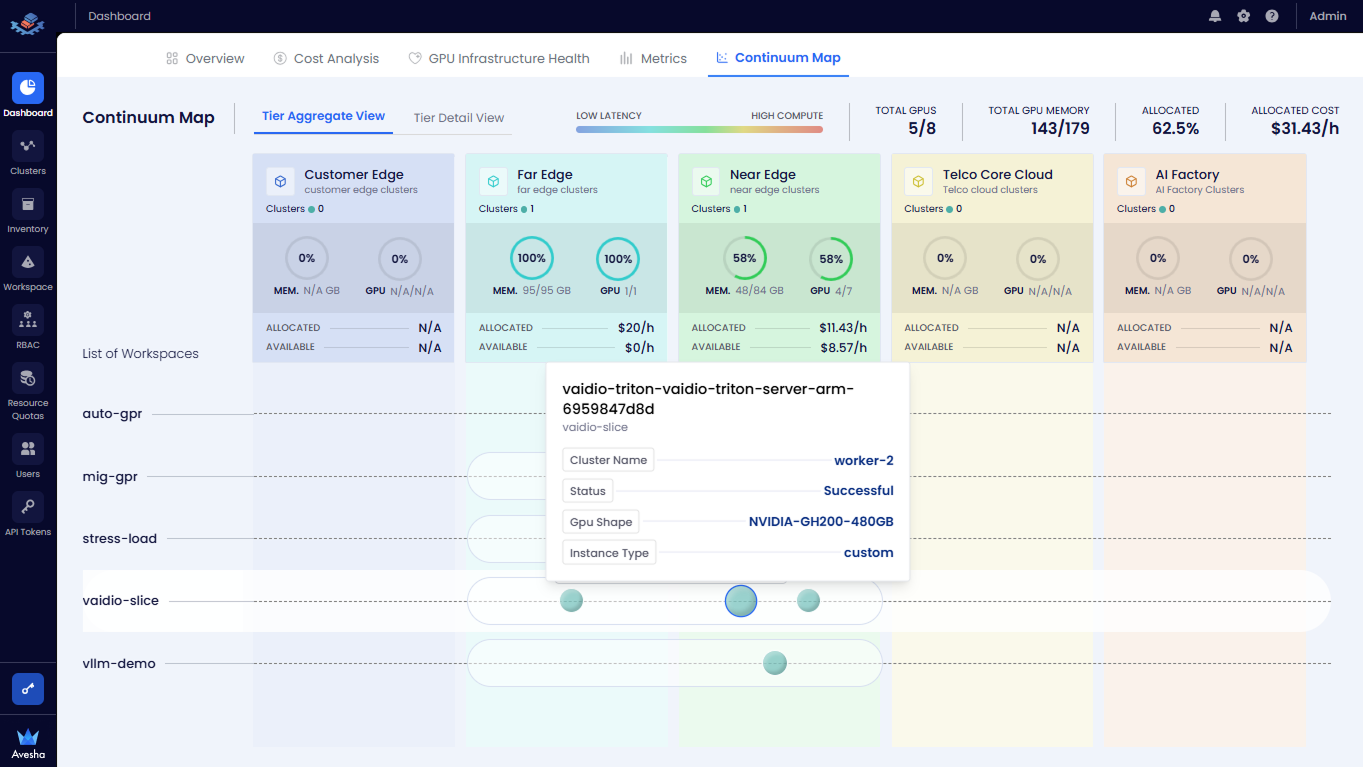
On the Workload Distribution pane, view the following details:
-
For the selected workspace, view the list of workloads deployed across different tiers.
-
A square marker represents a single workload instance (pod) placed on a cluster in that tier.
-
The position of the square indicates the cluster and tier (for example, Far Edge or Customer Edge) where the workload is scheduled.
The presence of a square signifies consumed capacity on that cluster. Hovering or selecting a square opens a workload details popover showing name, status, namespace, and assigned cluster.
-
Switch Views
-
To view more granular information, click Tier Detail View at the top of the page.
-
This switches the visualization from aggregated tier data to detailed cluster-level breakdowns within each tier.
-
Select the required tier from the Tier drop-down list to view specific tier details. For example, select the Near Edge tier.
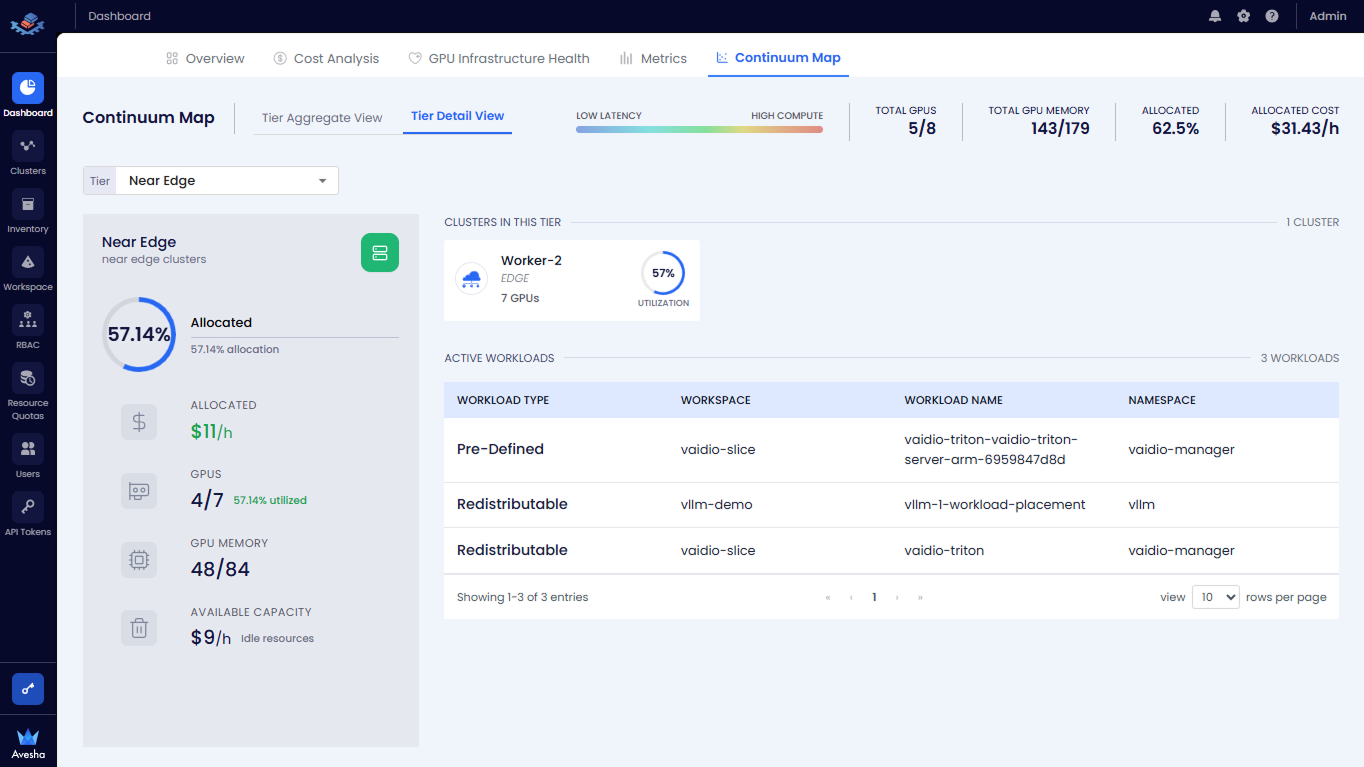
View Tier Allocation Summary
In the left summary panel, view the following global metrics for the selected tier:
- Allocated (%): Displays the percentage of GPU resources currently allocated in the tier.
- Allocated Cost: Displays the hourly cost of allocated GPU resources.
- GPU Utilization: Displays GPUs in use versus total GPUs (for example, 4/7 GPUs).
- GPU Memory Usage: Displays used versus total GPU memory (for example, 48/84 GB).
- Available Capacity: Displays the hourly cost of idle GPU resources.
View Cluster-Level Details
In the Clusters in This Tier section, view the list of clusters.
For each cluster, view:
- Cluster name
- Cluster type (Edge/Core)
- Total GPUs in the cluster
- GPU utilization percentage
View Active Workloads in Tier
Scroll to the Active Workloads section. View the table listing workloads running in the selected tier.
For each workload, view:
- Workload Type (Pre-Defined or Redistributable)
- Workspace
- Workload Name
- Namespace
Delete the Continuum Map
To delete the Continuum Map from the Dashboard:
-
Go to the Settings options by clicking the gear icon at the top-right corner of the Admin Portal.
-
From the Settings menu, select Continuum Map.
-
On the Continuum Map page, select the Continuum Map that you want to delete.
-
Click the delete icon next to the Continuum Map.
-
On the confirmation dialog box, click the Delete button to delete the Continuum Map from the Dashboard.
The Continuum Map is deleted from the Continuum Map tab on the Dashboard page.
After deleting a Continuum Map, any clusters associated with that map will no longer have a tier designation. The clusters will still function normally, but they will not be represented in the Continuum Map visualization on the Dashboard.