Dashboard
This topic describes how to view and interpret the dashboard, which provides the users a real-time, comprehensive overview of GPU-related data and usage across their assigned workspaces.
The dashboard feature three main tabs: Overview, Cost Analysis, and GPU Infrastructure Health.
The dashboard helps users monitor performance, understand usage patterns, and make informed decisions about their AI workloads.
Across our documentation, we refer to the workspace as the slice workspace. The two terms are used interchangeably.
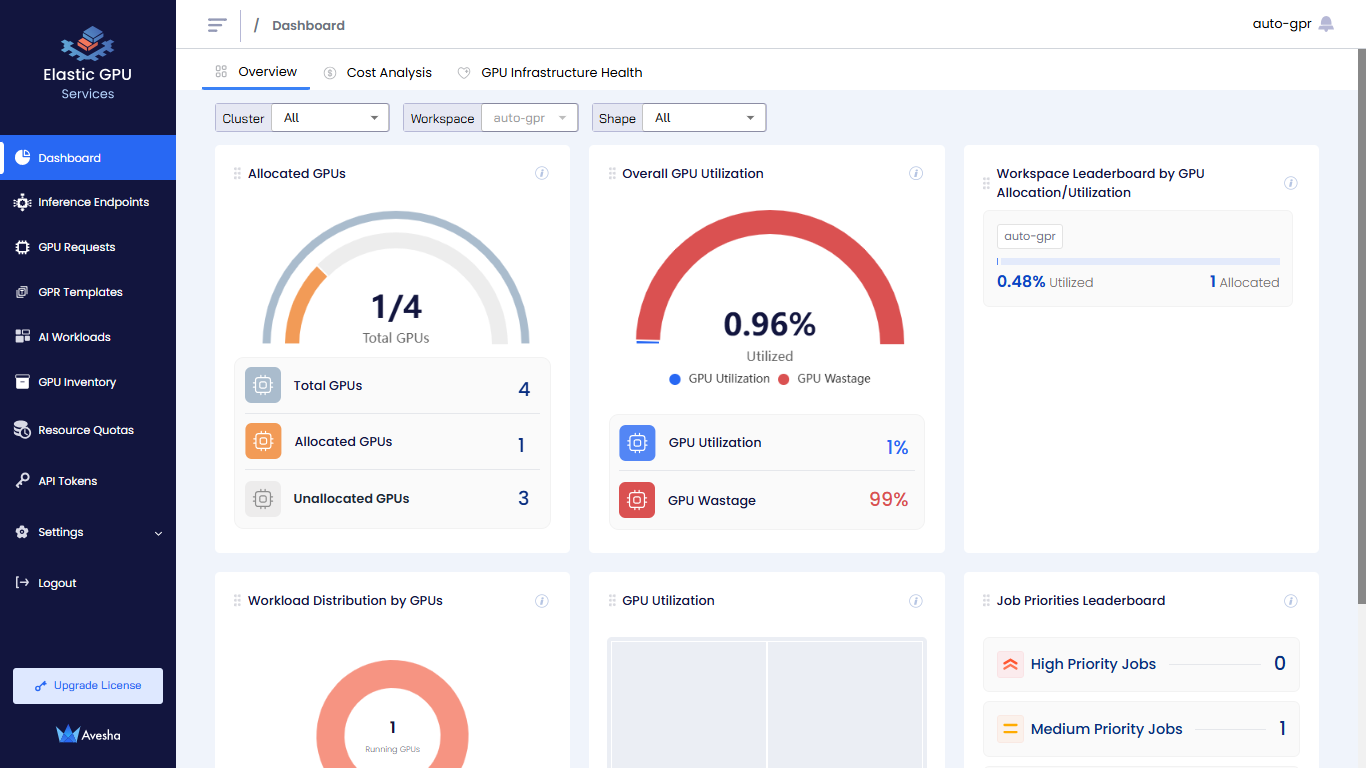
Overview of GPU Allocation and Utilization
The following figure illustrates the Allocated GPUs, GPU Utilization, and Workspace Leaderboard by GPU Allocation/Utilization tiles.
- Allocated GPUs: A breakdown of total GPUs, allocated GPUs, and unallocated GPUs.
- Overall GPU Utilization: The GPU utilization and wastage in percentage.
- Workspace Leaderboard by GPU Allocation/Utilization: The GPU allocation and utilization aggregated by workspace.
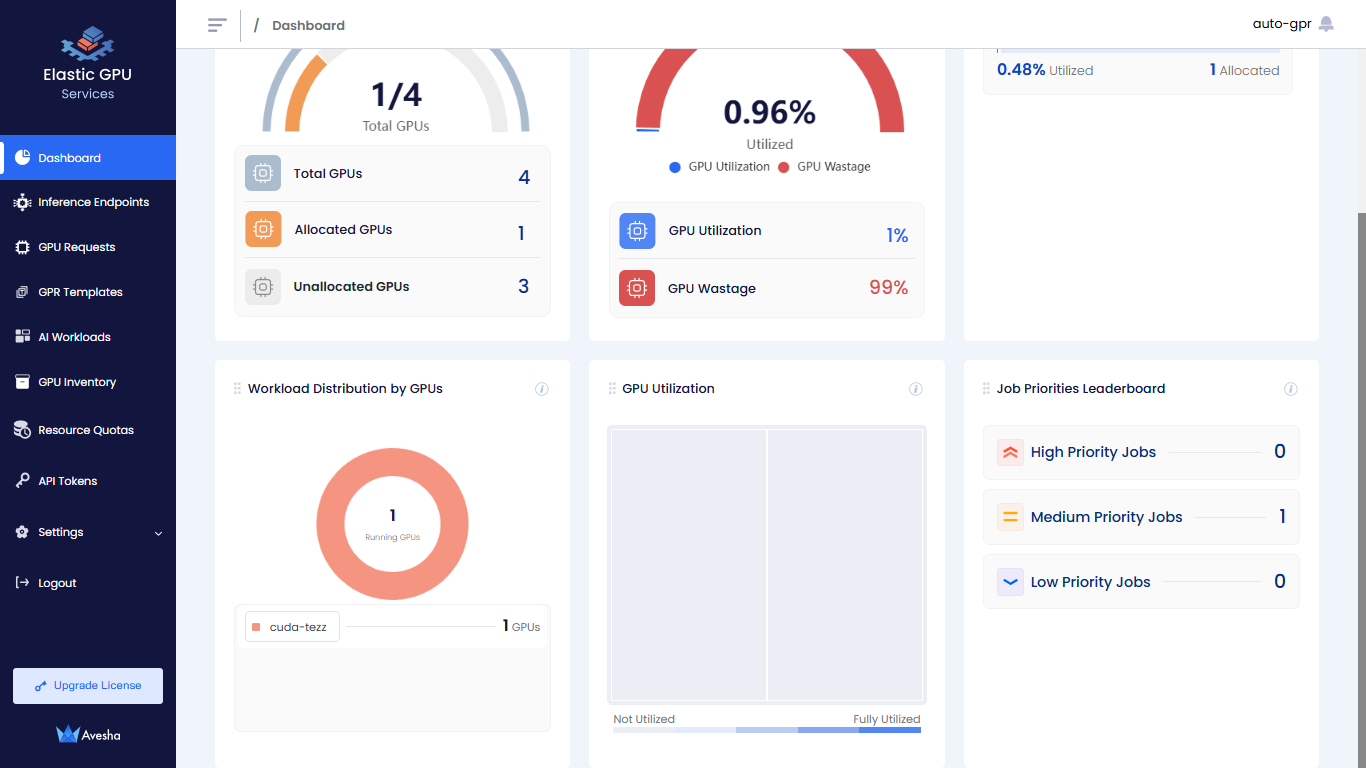
The following figure illustrates the Workload Distribution by GPUs, GPU Utilization and Job Priorities Leaderboard tiles.
- Workload Distribution by GPUs: The GPUs distributed per workload.
- GPU Utilization: The GPU utilization visualized in a treemap.
- Job Priorities Leaderboard: The jobs categorized by priorities.
GPU Cost Analysis
The following figure illustrates the GPUs Cost, GPU Wastage Cost, and Workspace Leaderboard tiles.
- GPUs Cost: Displays the total GPU cost, broken down into allocated and unallocated GPU costs.
- GPU Wastage Cost: Shows the GPU utilization cost along with the wastage cost.
- Workspace Leaderboard: Aggregates the utilization and allocated cost by workspace.
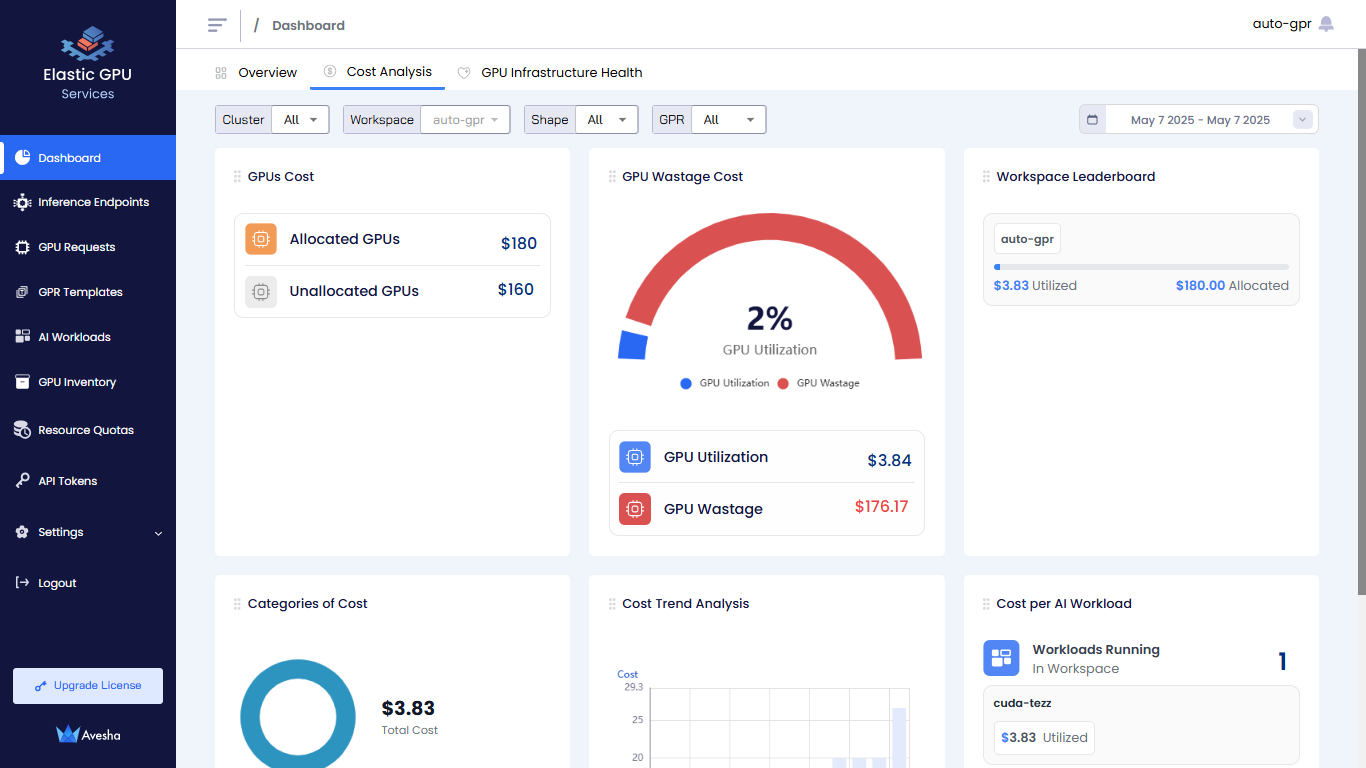
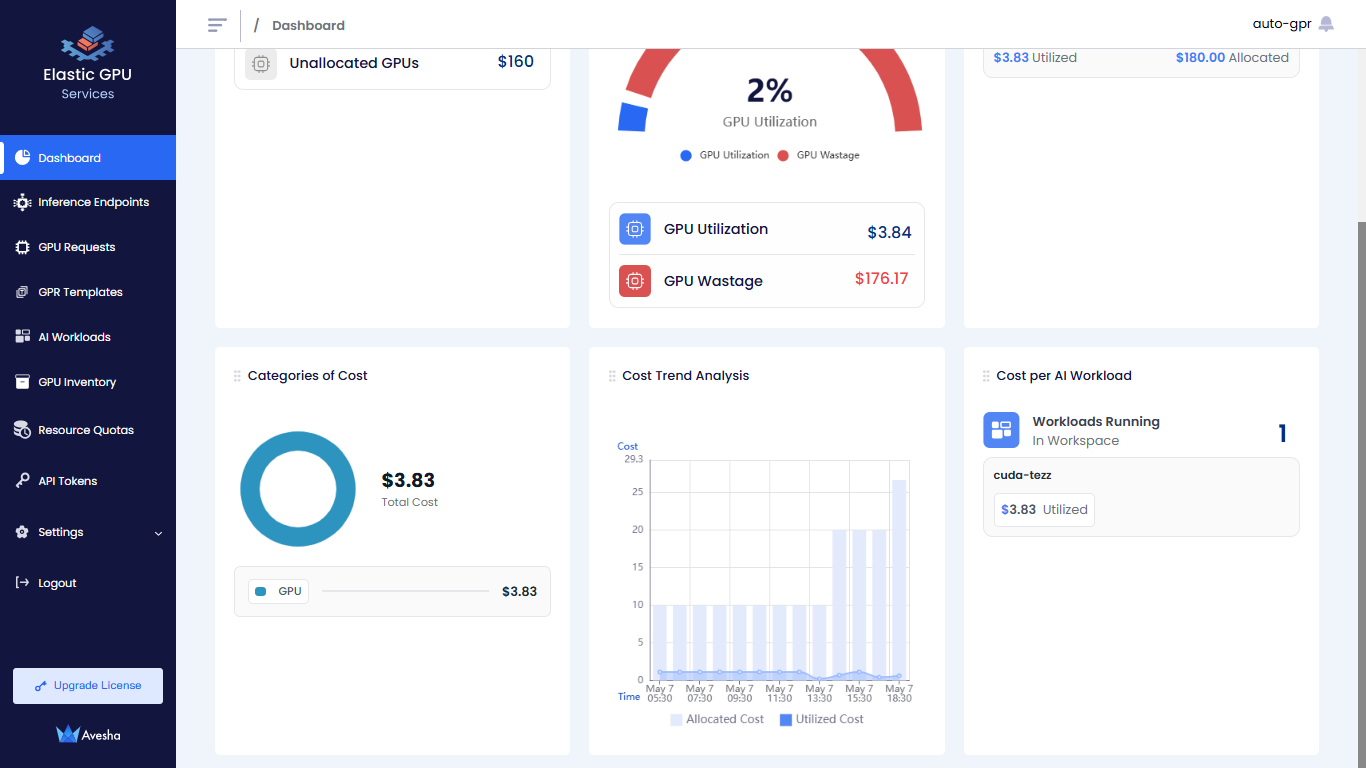
The following figure illustrates the Categories of Cost, Cost Trend Analysis, and Cost per AI Workload tiles.
- Categories of Cost: Breaks down the utilization cost by node components.
- Cost Trend Analysis: Provides a chart comparing the allocated cost to the utilized cost over time.
- Cost Per AI Workload: Shows the utilization cost associated with each AI workload.
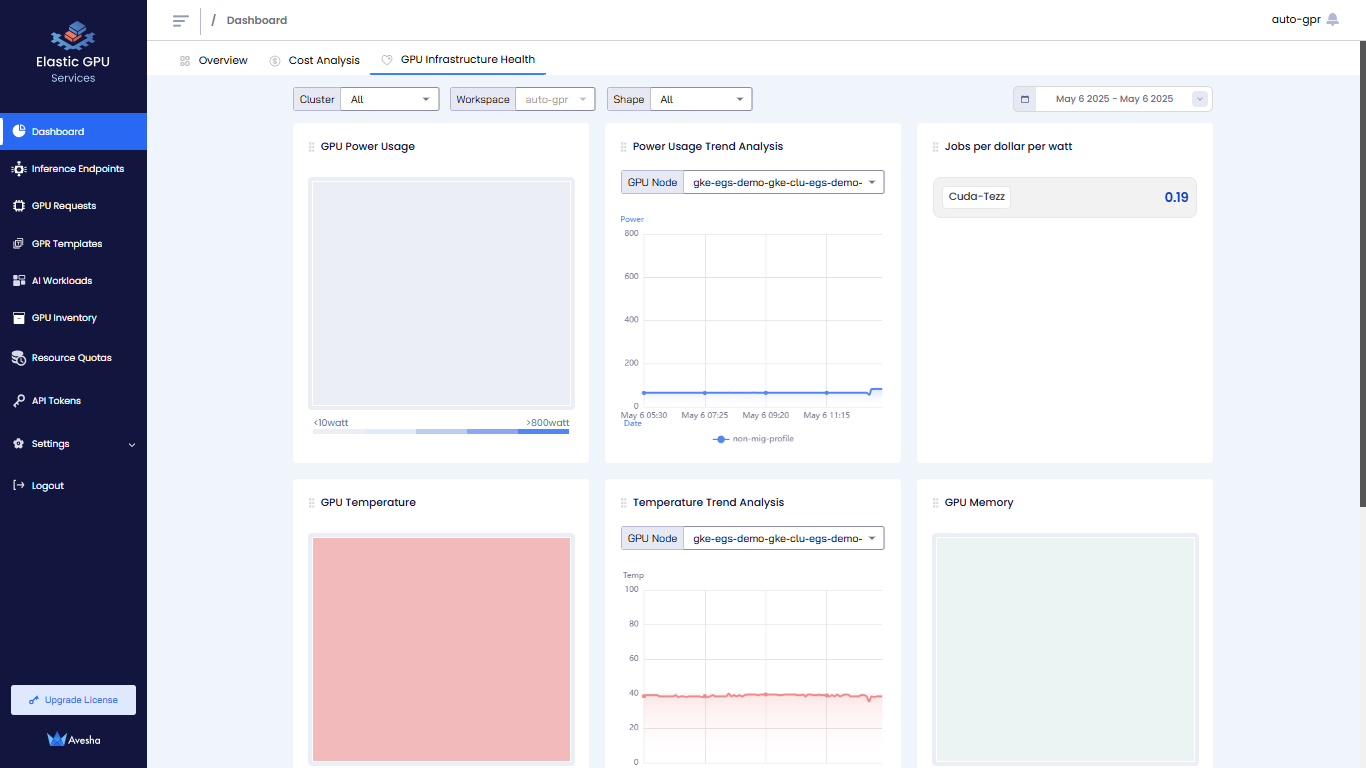
GPU Infrastructure Health
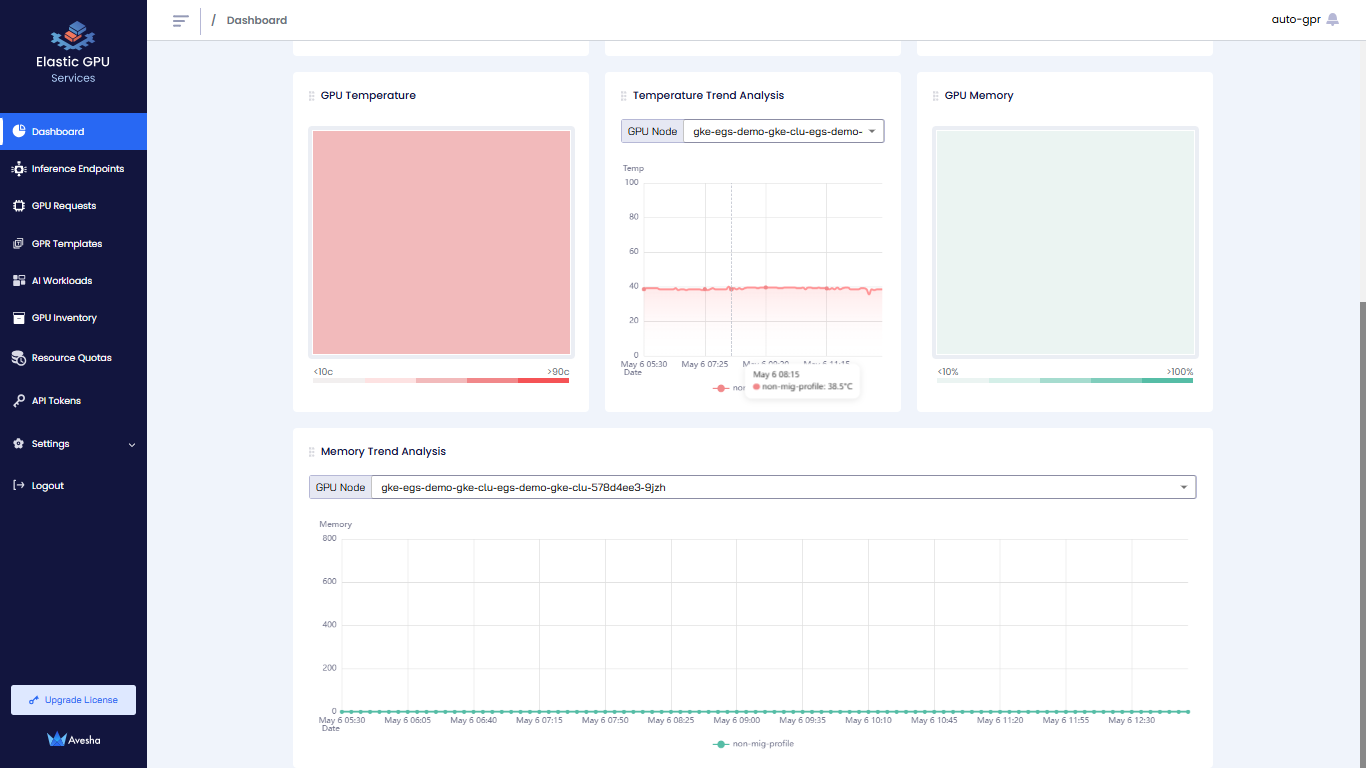
The following figure illustrates the GPU Power Usage, Power Usage Trend Analysis, Jobs per dollar per watt, GPU Temperature, Temperature Trend Analysis, and GPU Memory tiles.
- GPU Power Usage: The maximum power usage in Watt per each GPU during the selected time period.
- Power Usage Trend Analysis: The hourly power usage trend per each GPU. You can choose the GPU Node from the drop-down list to analyze its GPUs' power usage.
- Jobs per dollar per watt: The list of jobs/workloads with the associated US Dollar per Watt cost. The value is calculated by GPU Hourly Cost/Average Workload Power Usage.
- GPU Temperature: The maximum temperature per each GPU during the selected time period.
- Temperature Trend Analysis: The hourly temperature trend per each GPU. You can choose the GPU Node from the drop-down list to analyze its GPUs' temperature.
- GPU Memory: The maximum memory usage per each GPU.
The following figure illustrates the Memory Trend Analysis tile.
- Memory Trend Analysis: The hourly memory usage trend per each GPU. You can choose the GPU Node from the drop-down list to analyze its GPUs' memory usage.