Monitor AI Workloads
You can monitor the AI workloads for all workspaces (slice workspaces) in your project.
info
Across our documentation, we refer to the workspace as the slice workspace. The two terms are used interchangeably.
However, at any given point in time, you can only view the AI model details of one workspace.
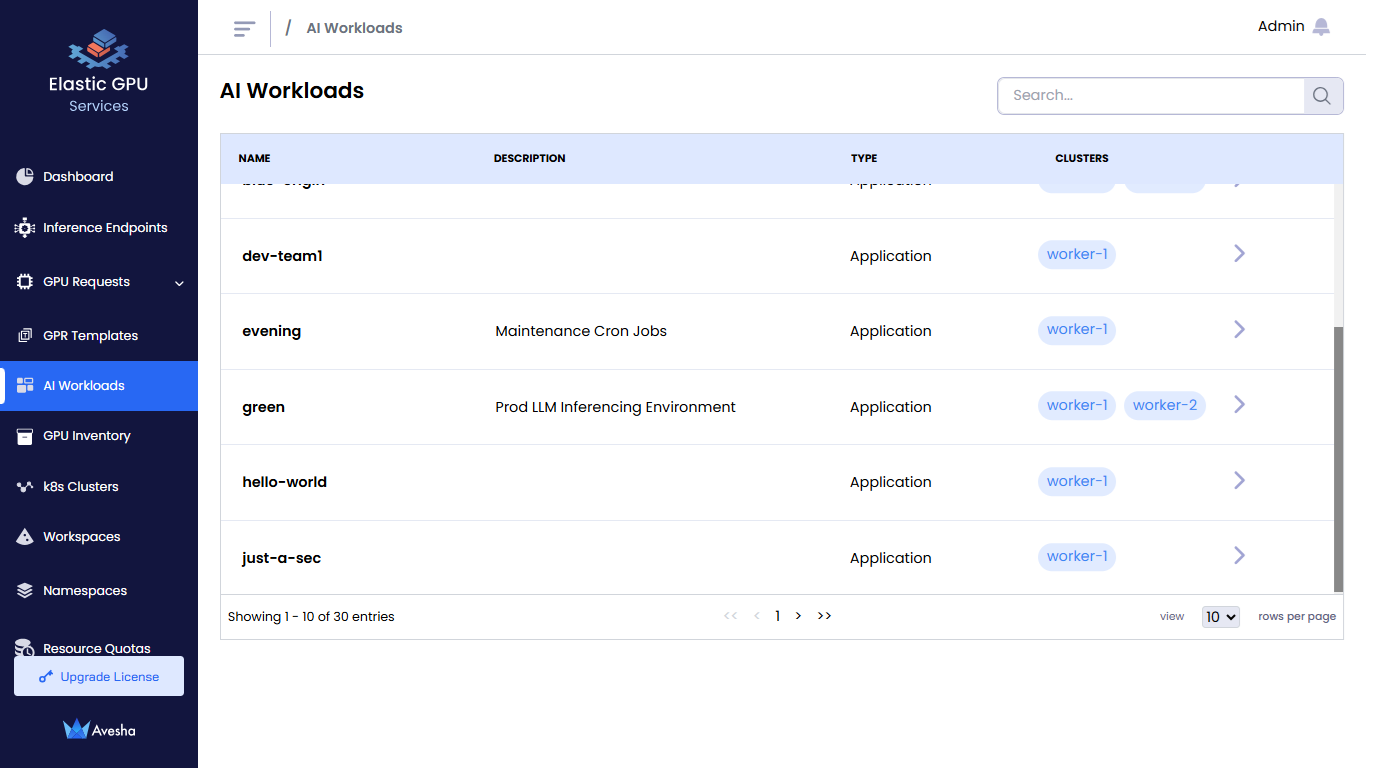
- Go to AI Workloads on the left sidebar.
- On the AI Workloads page, select a workspace to see the AI workloads.
AI Model Details
On the AI Workloads page, click the menu icon against a workspace to view AI workload and model details.
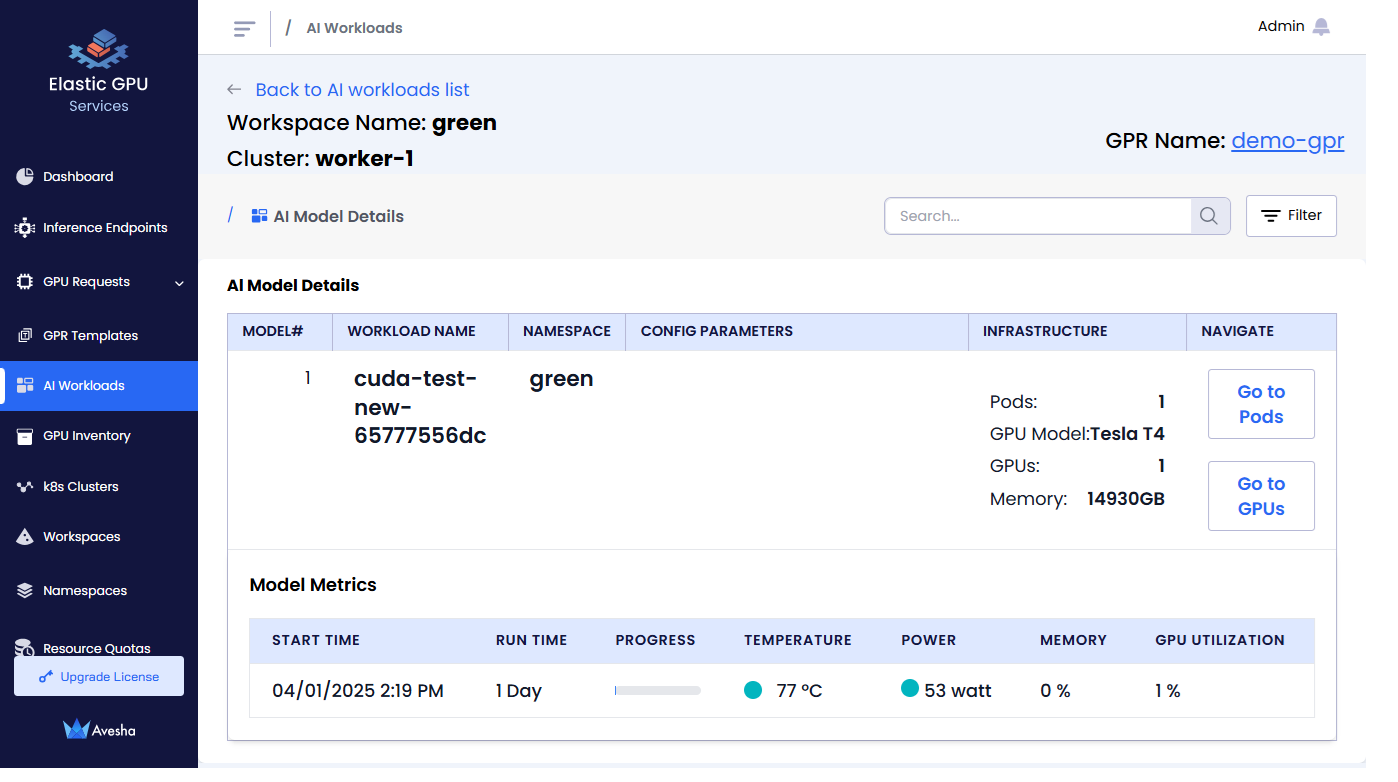
The AI model details:
- Shows the model details, GPU infrastructure committed to the workload
- Shows model summary that includes high power GPU, high temperature GPU, and average utilization values
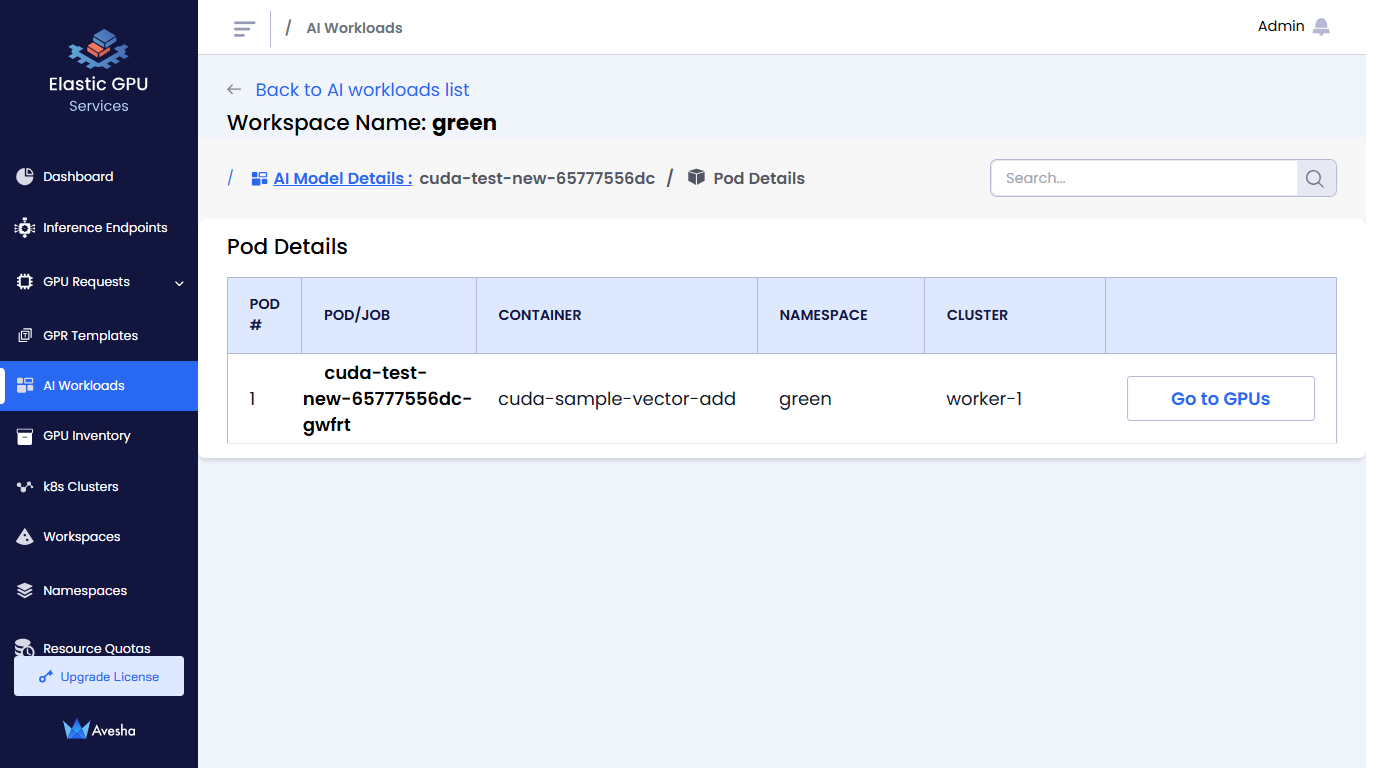
View Pods
On the AI Model Details page, click Go to Pods to view the pods running with GPUs in a workspace.
View GPUs
On the AI Model Details page (or under Pod Details), click Go to GPUs to view the GPU table page.
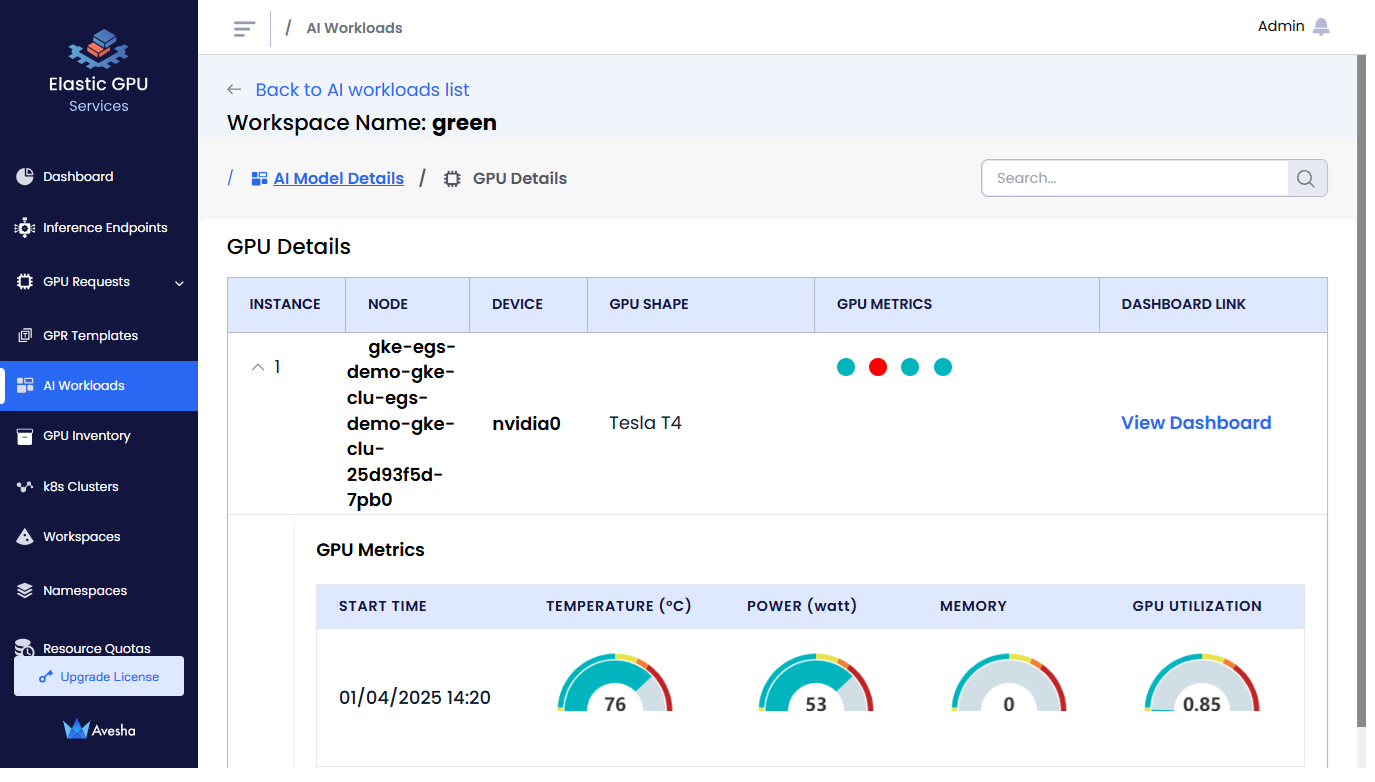
The GPU table:
- Shows sorted list of GPUs with high power and temperature GPUs at the top for quick access
- Shows the hot spot GPUs
Under GPU Details, click View Dashboard in the table to view time-series data for the selected GPU device.