Monitor the Dashboard
The dashboard page provides admins an aggregated live view of all GPU related information at a glance. An admin can use the dashboard to monitor key metrics related to the GPU pool. The key metrics include GPRs, GPU utilizations, allocations, errors, power, and temperature usage of the GPUs.
Across our documentation, we refer to the workspace as the slice workspace. The two terms are used interchangeably.
The dashboard contains the following tabs:
- Overview
- Cost Analysis
Monitor the Dashboard Overview
Overview is the default tab on the Dashboard landing page.
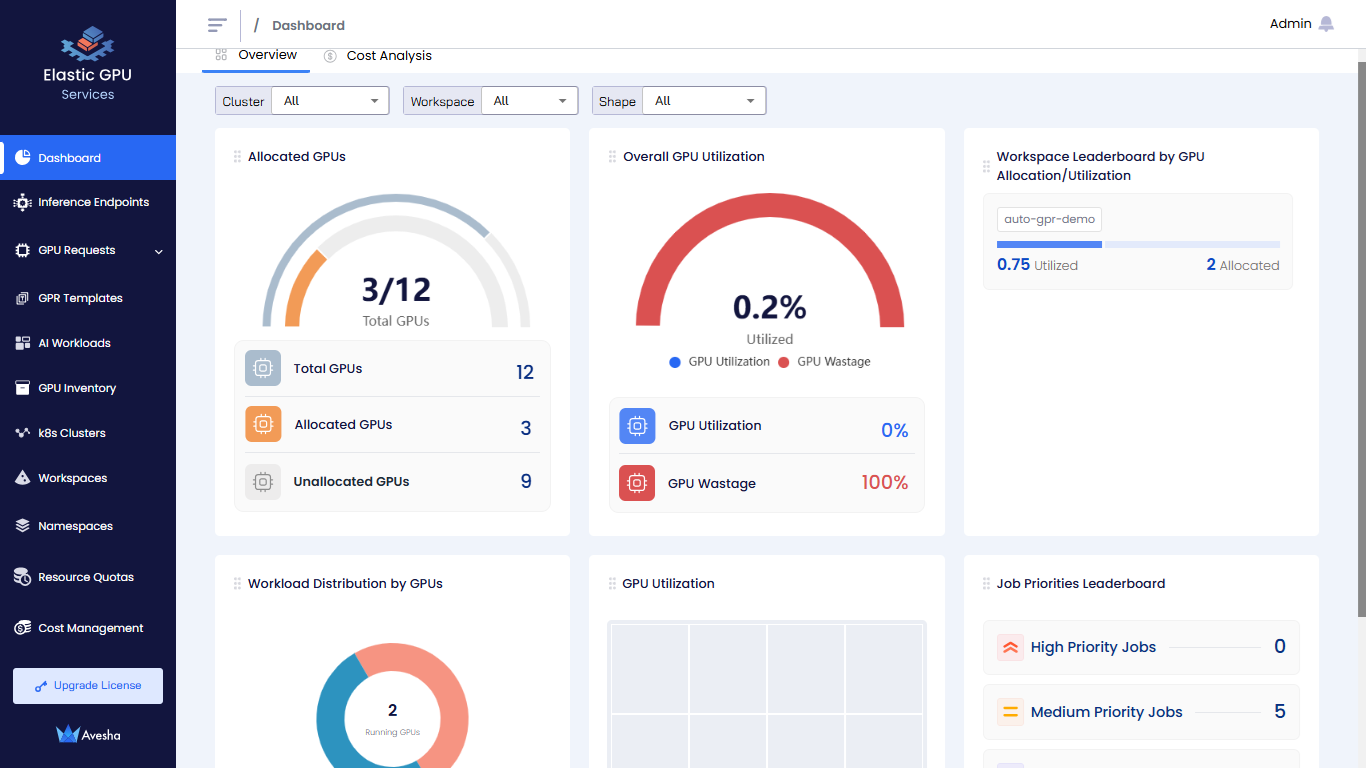
- Allocated GPUs: A breakdown of total GPUs, allocated GPUs, and unallocated GPUs.
- Overall GPU Utilization: The GPU utilization and wastage in percentage.
- Workspace Leaderboard by GPU Allocation or Utilization: The GPU allocation and utilization aggregated by workspace.
Scroll towards the bottom of the dashboard to see the following tiles:
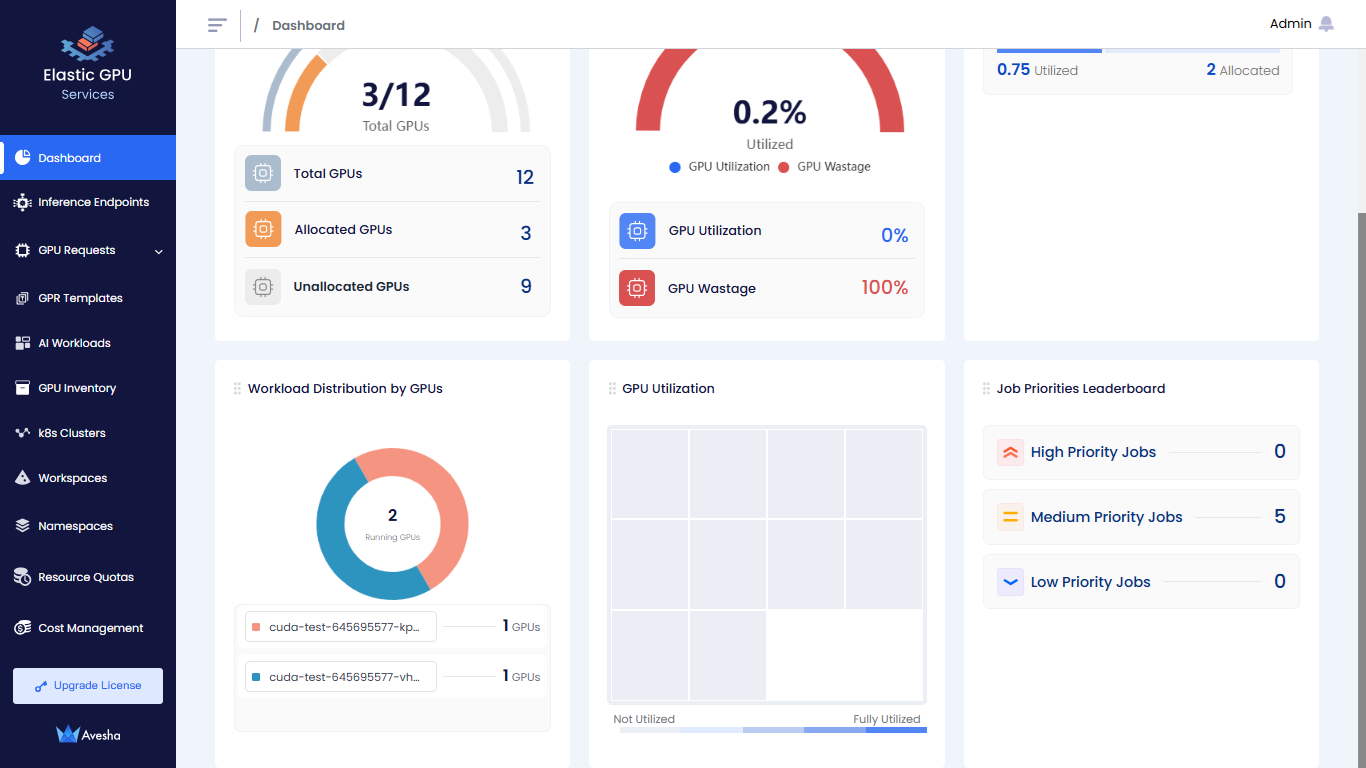
- Workload Distribution by GPUs: The GPUs distributed per workload.
- GPU Utilization: The GPU utilization visualized in a treemap.
- Job Priorities Leaderboard: The jobs categorized by priorities.
Analyze the GPU Cost
To analyze the GPU cost, go to Cost Analysis on the Dashboard page.
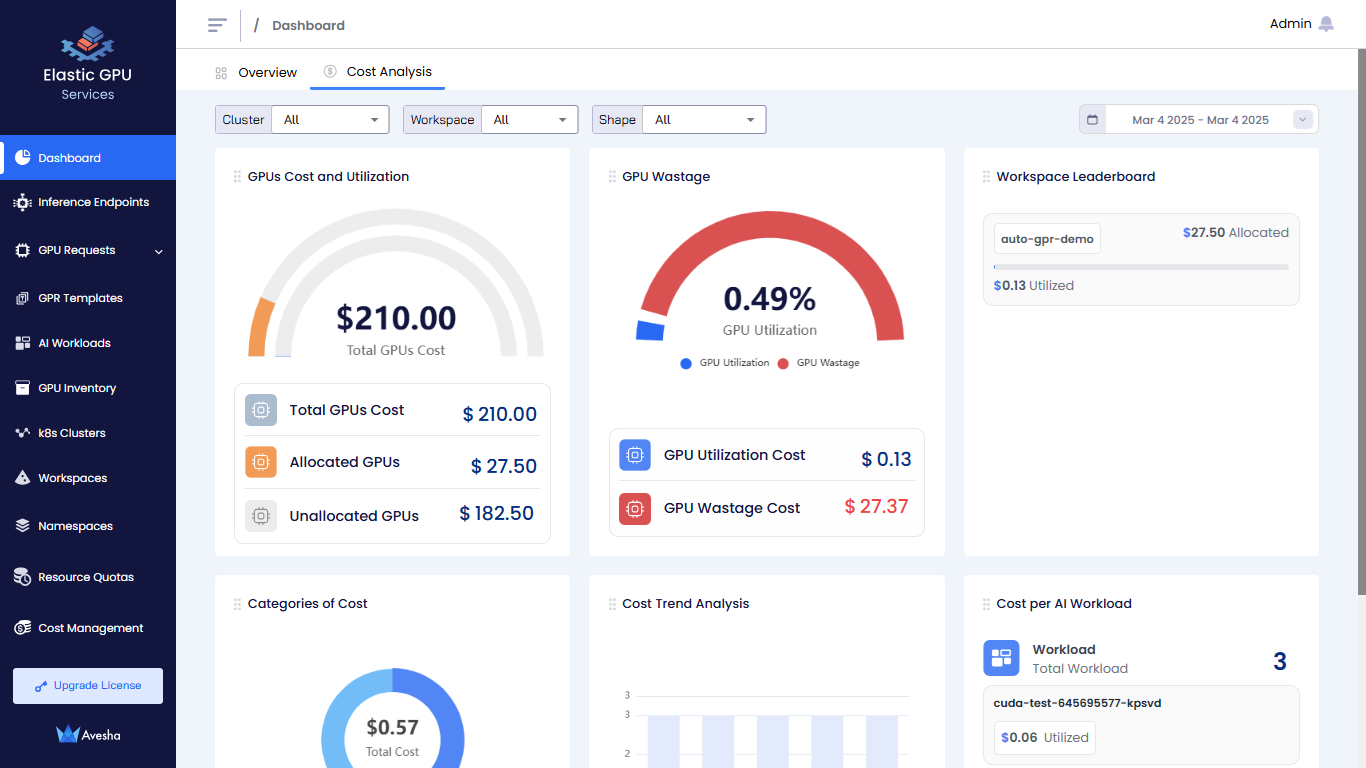
- GPUs Cost and Utilization: The total GPUs cost with a breakup of allocated and unallocated GPUs cost.
- GPU Wastage: The GPU utilization cost and wastage cost.
- Workspace Leaderboard: The utilization and allocated cost aggregated by workspace.
Scroll towards the bottom of the dashboard page to see the following tiles:
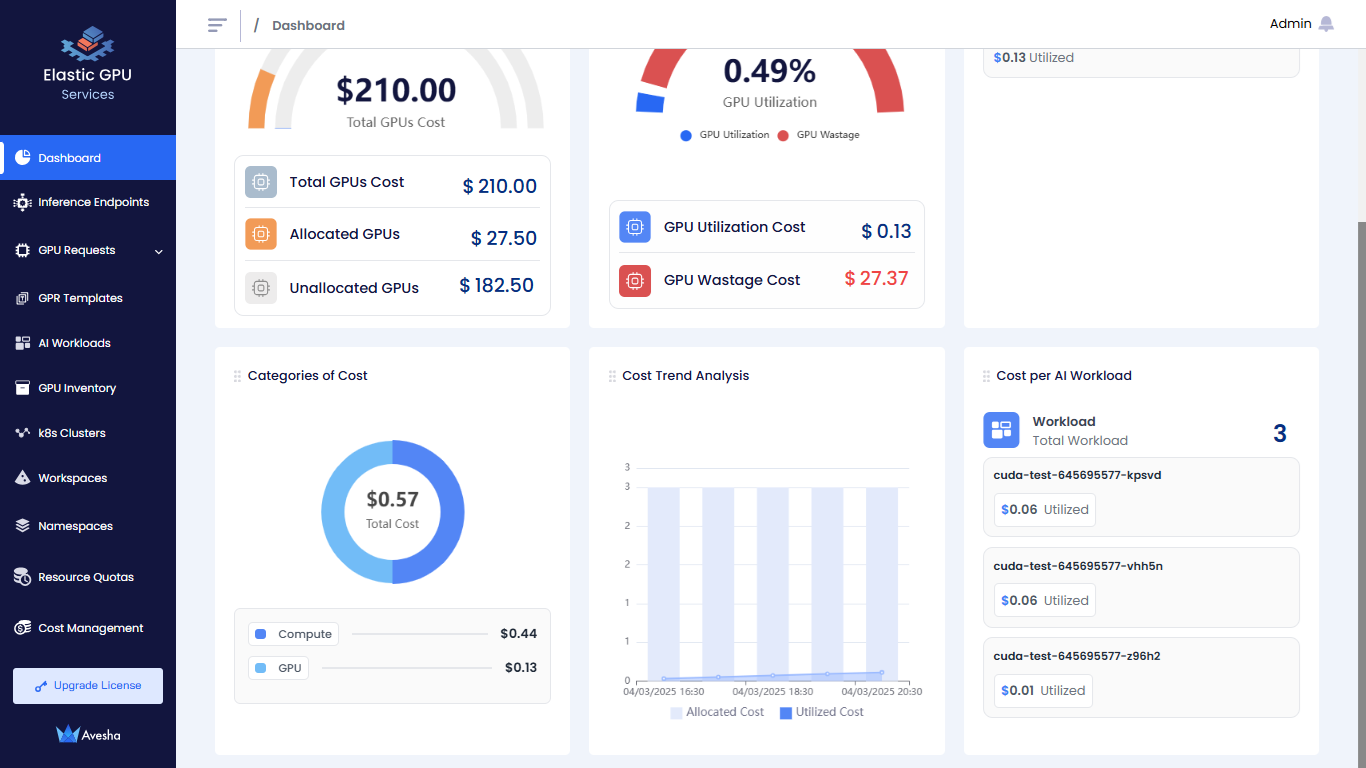
- Categories of Cost: The utilization cost aggregated by node components.
- Cost Trend Analysis: The chart representation of the allocated cost versus utilized cost.
- Cost per AI Workload: The utilization cost per AI workload.
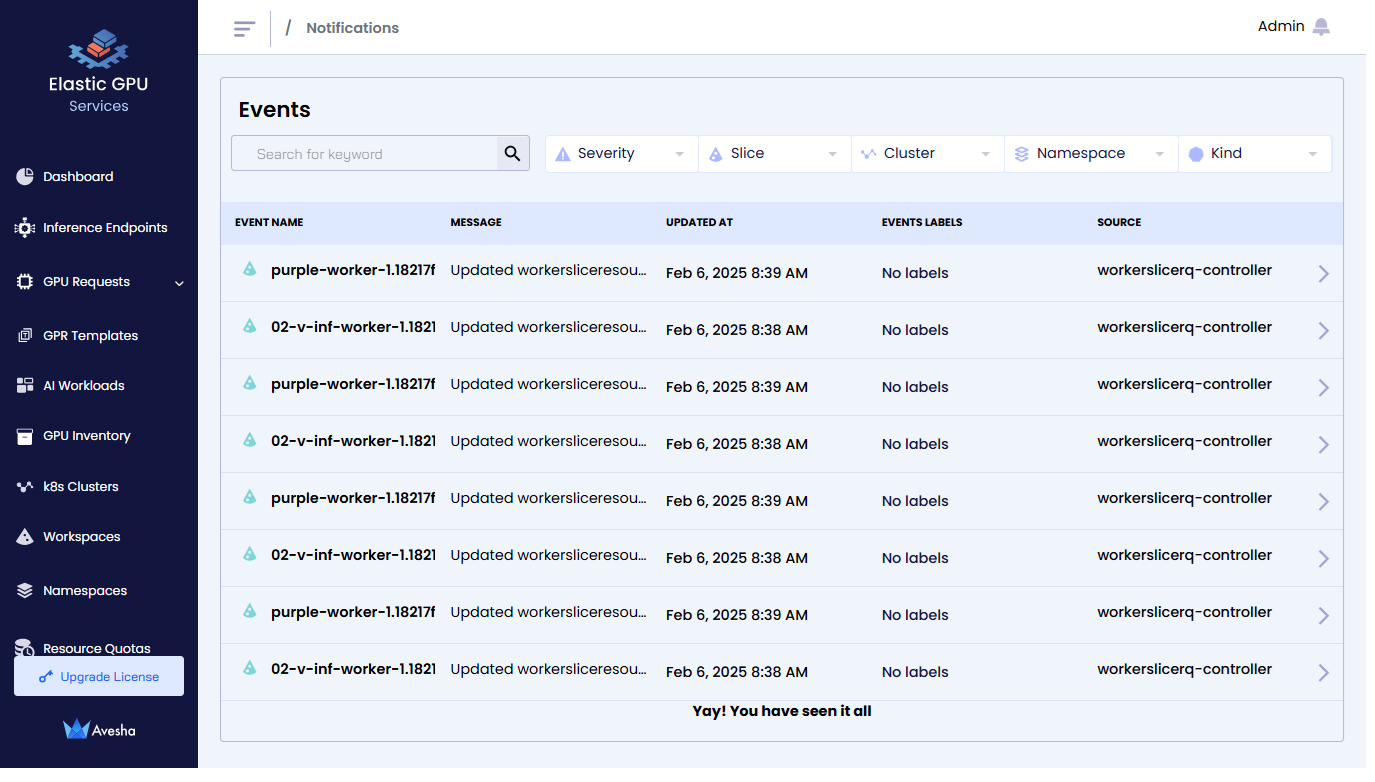
View Events
On any page of the EGS Admin platform, you can see the event notifications.
To view the events:
-
Click the bell icon at the top-right corner of any page on the Admin Portal.
-
The Events page lists all the GPR events.