Monitor AI Workloads
This topic describes the steps to view the deployed AI models on the EGS portal. You can access the cluster namespaces using the slice workspace kubeconfig file received from your admin. Using
the portal, you can deploy the AI workloads only in these namespaces.
- The user slice workspace is isolated from other users or slice workspaces. The GPR provisioned GPU nodes are available for the user for the duration of the GPR.
- Contact your admin for the kubeconfig file to access the cluster.
View AI Workloads
You can view AI workloads and associated GPU details running on the slice workspaces. EGS provides highly granular visualization for every AI workload and associated GPUs, you see these details:
- AI workloads list model, model configuration, and infrastructure committed for the workload (LLM training or fine-tuning job).
- Visibility into high-power usage GPU, high-temperature GPU. Generates alerts on high power/utilization levels.
- Visibility into GPU metrics dashboards for user's AI workloads parameters/GPU metrics.
View Model Details
-
Go to AI Workloads on the left sidebar.
-
Select a slice workspace to see the AI workloads.
-
Select the user slice workspace to see AI workloads, and it:
- Shows the model details and GPU infrastructure committed to the workload.
- Shows model summary: high power GPU, high temperature GPU, and average utilization values.
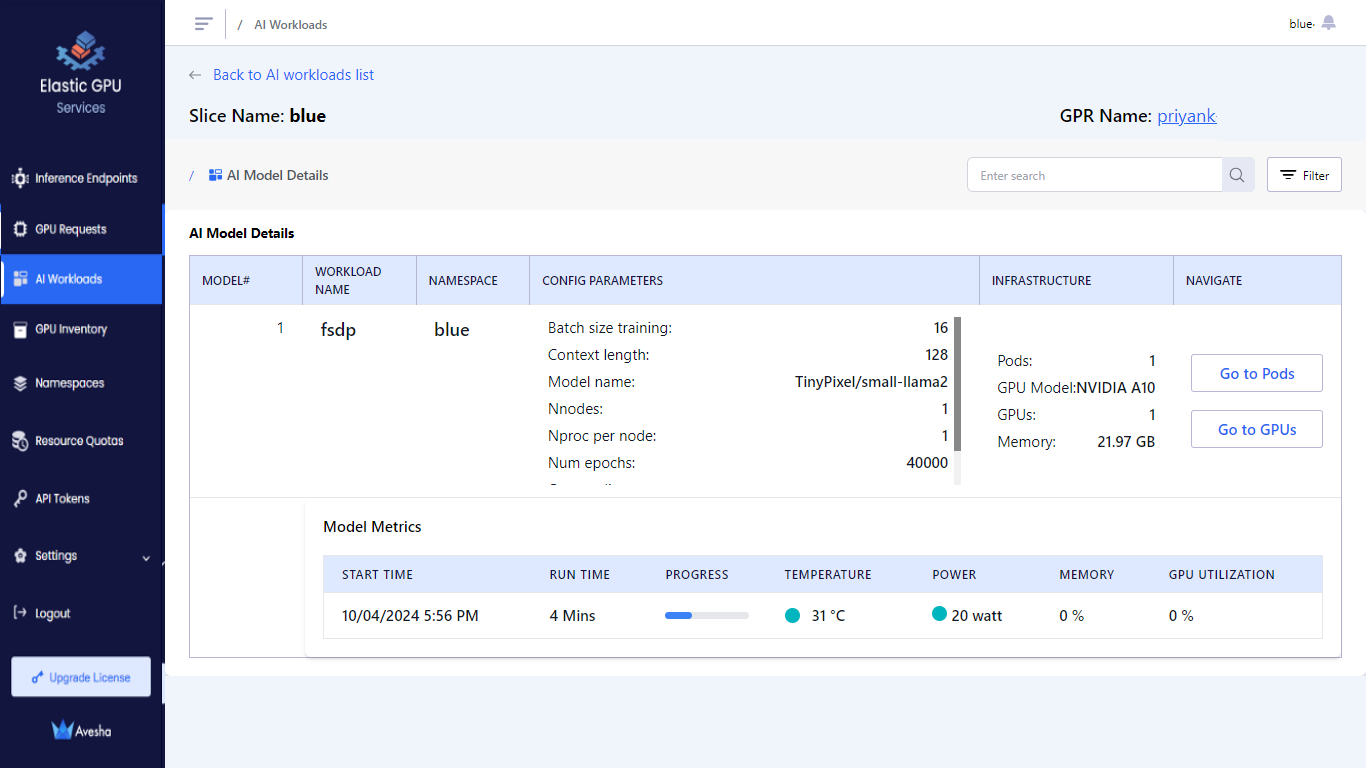
-
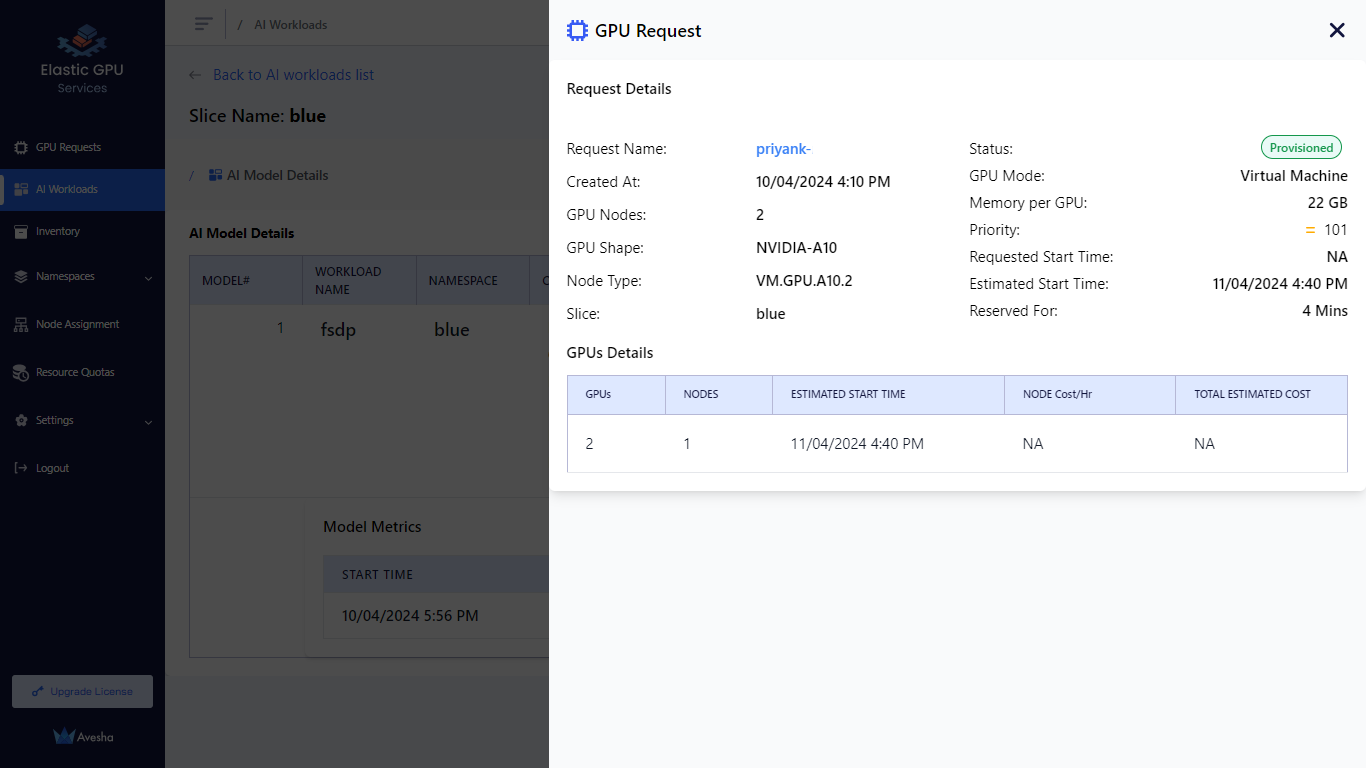
On the AI workloads page, to view the GPR details click on the GRP name on the top right.
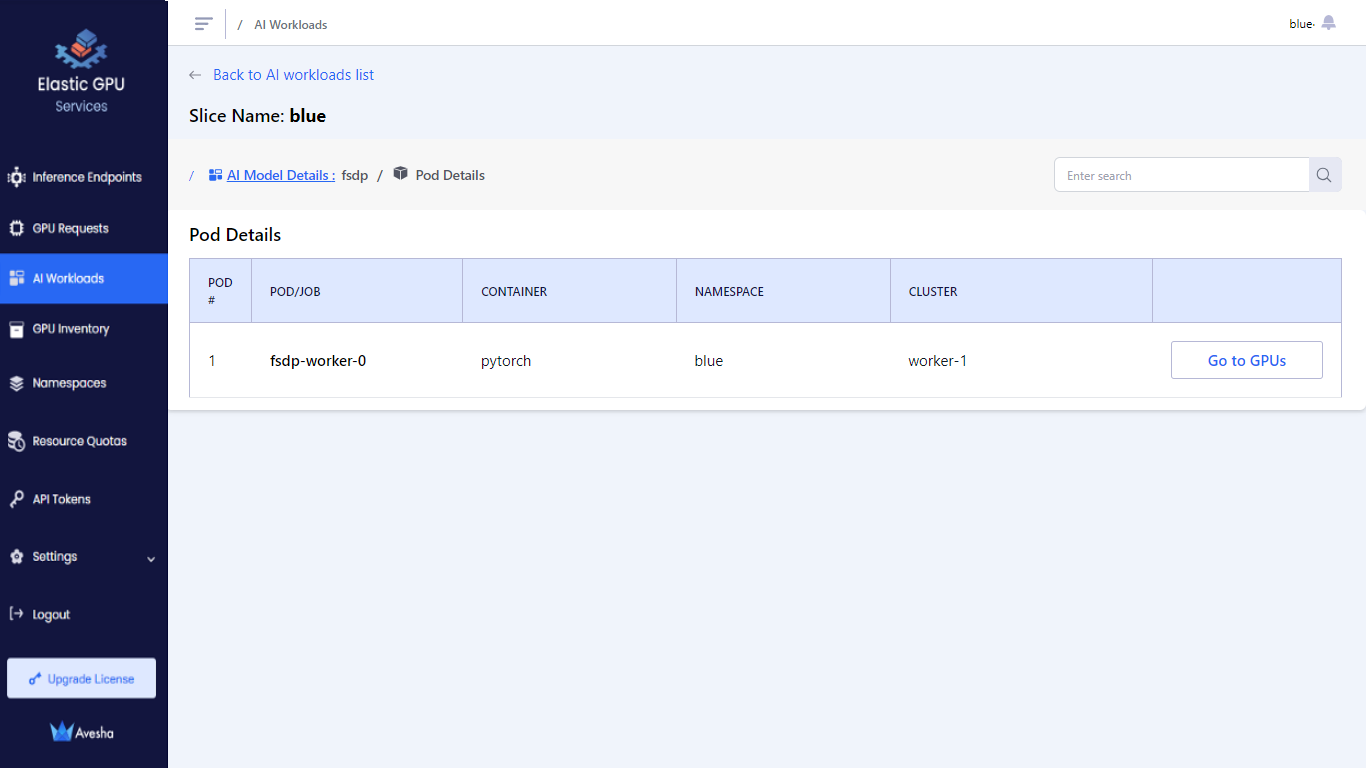
View Pods
To view pods:
-
Go to AI Workloads on the left sidebar.
-
Select a slice workspace to see AI workloads for the slice workspace.
-
On the AI Model Details page, under NAVIGATE, click Go to Pods to view the pods running with GPUs on the slice workspace.
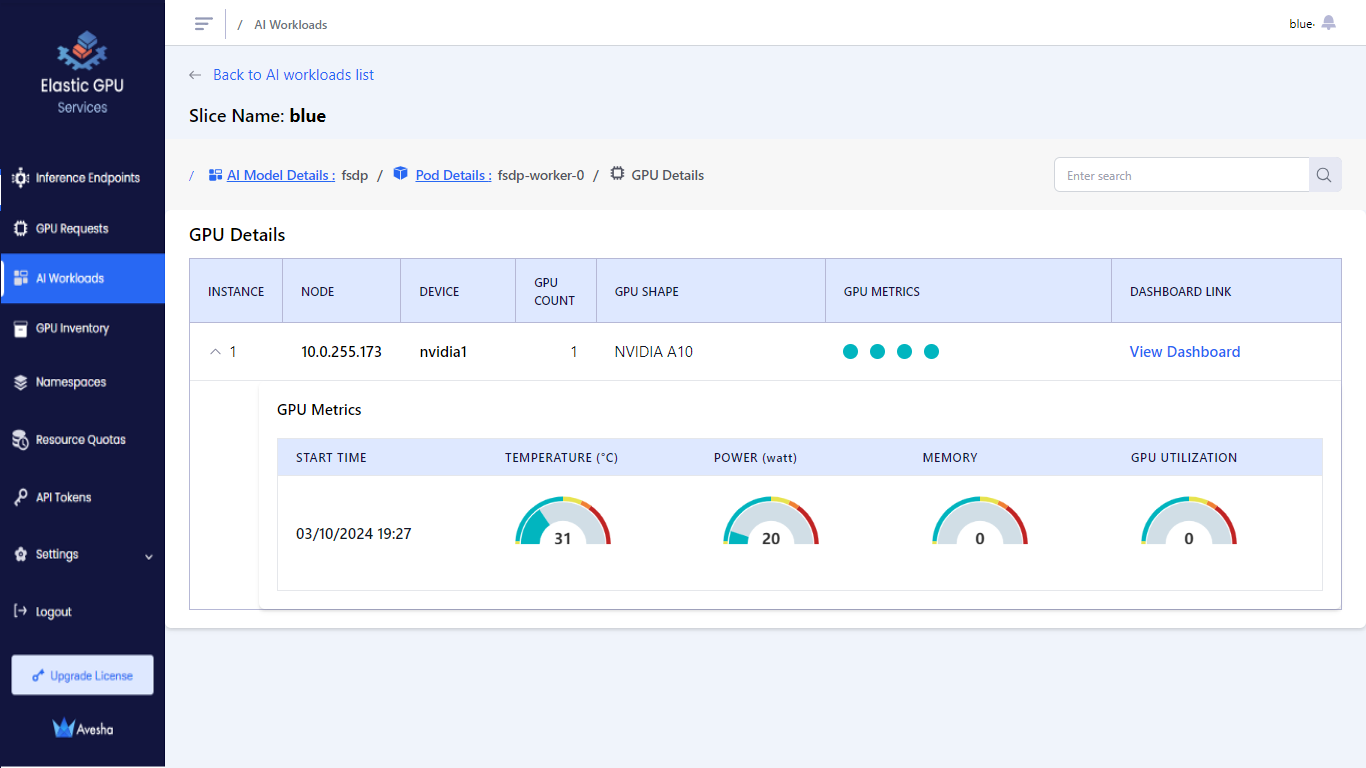
View GPUs
To view GPU:
-
Go to AI Workloads on the left sidebar.
-
Select the slice workspace to see AI workloads.
-
On the AI Model Details page, under NAVIGATE, click Go to GPUs to view the GPU details.
The GPU Details section:
-
Shows sorted list of GPUs with high power and temperature GPUs at the top for quick access.
-
Shows the hotspot GPUs.
-
Shows the time-series data for the selected GPU device.