Monitor the Dashboard
The dashboard page provides admins an aggregated live view of all GPU related information at a glance. An admin can use the dashboard to monitor key metrics related to the GPU pool. The key metrics include GPRs, GPU utilizations, allocations, errors, power, and temperature usage of the GPUs.
The dashboard contains the following tabs:
- Overview
- Cost Analysis
Monitor the Dashboard Overview
Overview is the default tab on the Dashboard landing page.
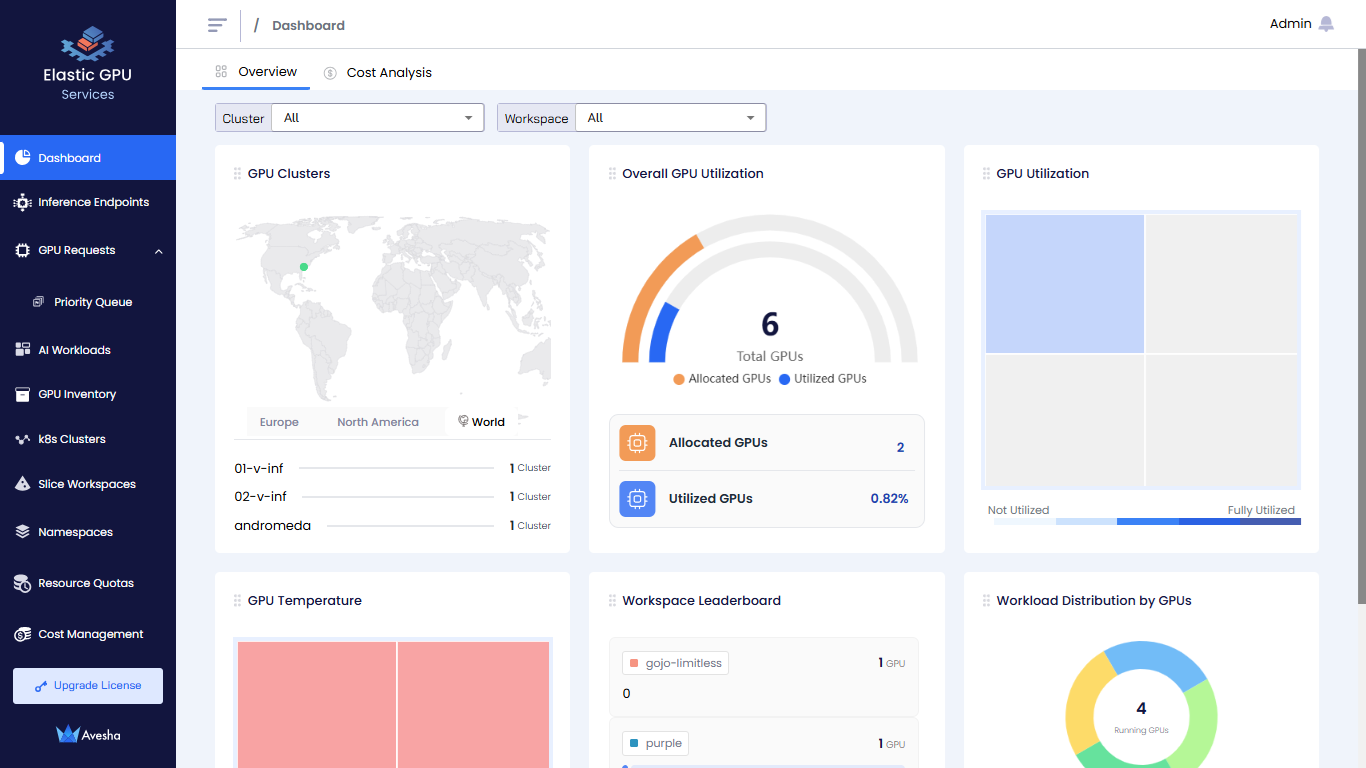
- GPU Clusters deployment map
- Overall GPU Utilization
- GPU Utilization
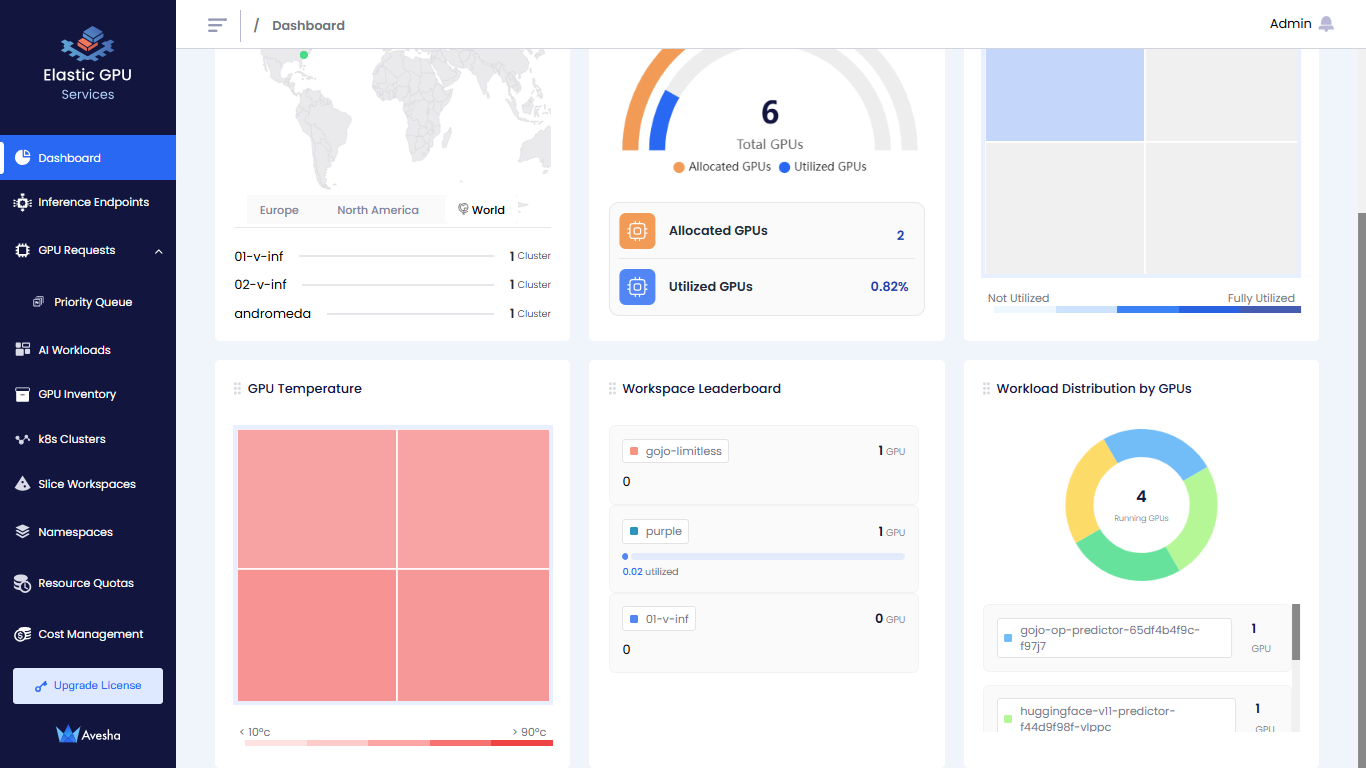
- GPU Temperature
- Workspace Leaderboard
- Workspace Distribution by GPUs
Analyze the GPU Cost
To analyze the GPU cost, go to Cost Analysis on the Dashboard page.
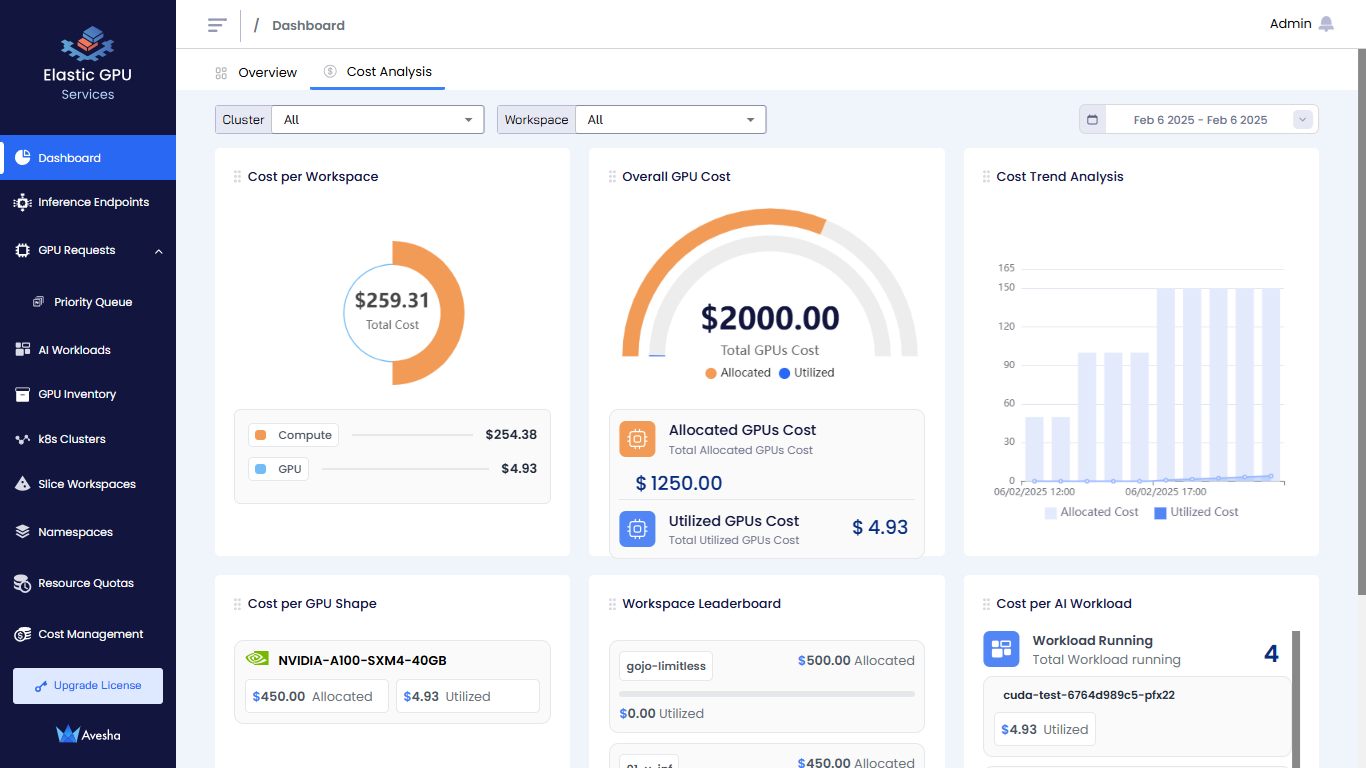
- Cost per workspace
- Overall GPU cost
- Cost Trend Analysis
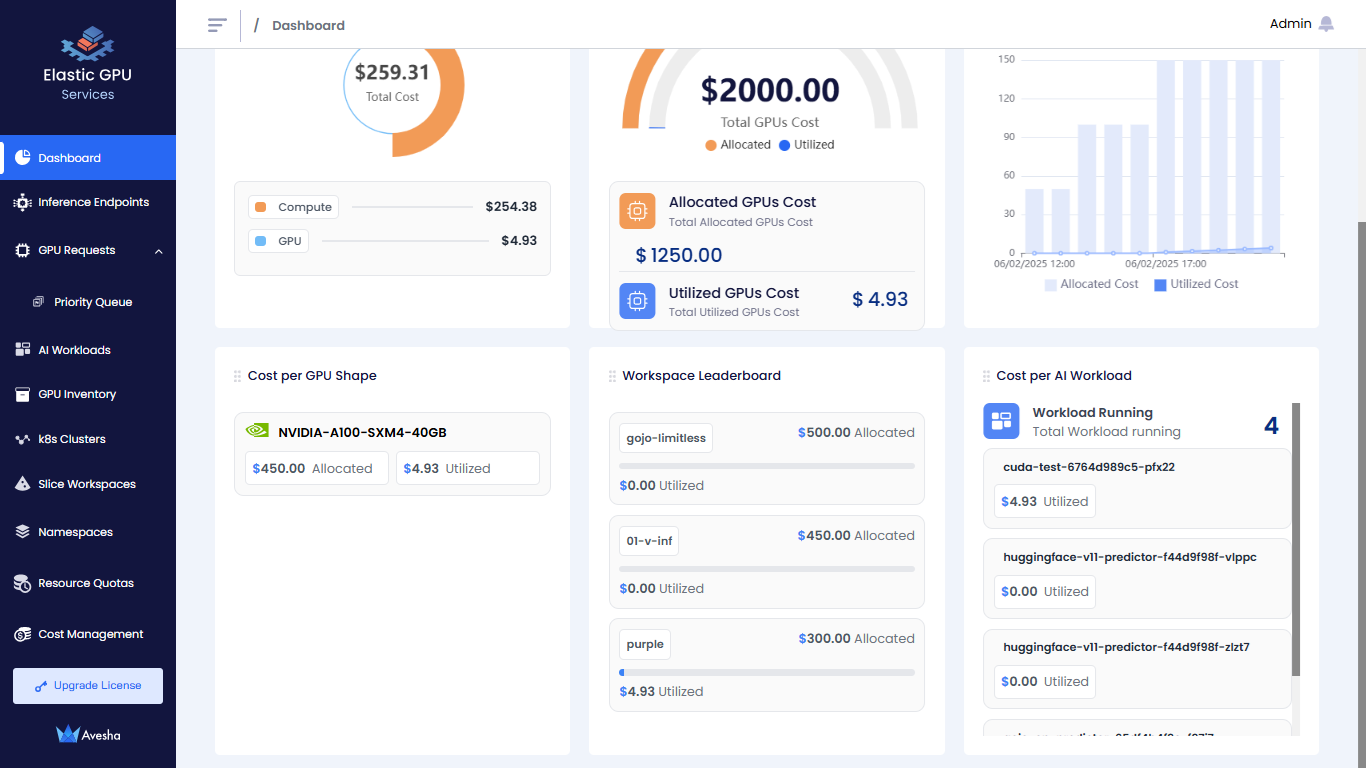
- Cost Per GPU Shape
- Workspace Leaderboard
- Cost per API Workload
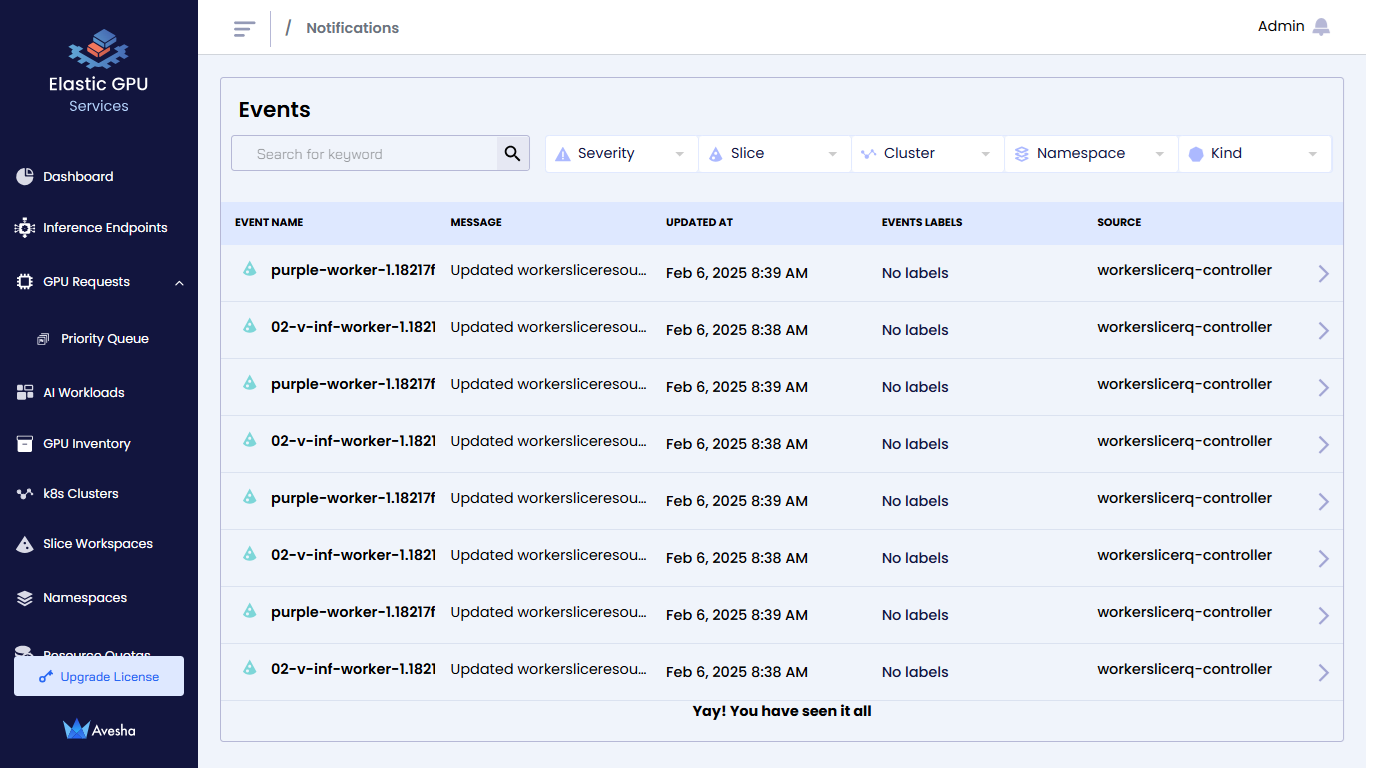
View Events
On any page of the EGS Admin platform, you can see the event notifications.
To view the events:
-
Click the bell icon at the top-right corner of any page on the Admin Portal.
-
The Events page lists all the GPR events.