Explore GPU Nodes Cost
This topic describes how to explore cost of GPU nodes on your clusters using the KubeTally feature.
Overview
This feature enables you to track the resource usage and the cost associated with it at the slice workspace level. The resource utilization and the total cost will be shown for a service in this user interface. There can be multiple services within a namespace of a cluster. Also, there can be multiple clusters within a slice workspace. The cost will be shown for each services under all namespaces and all clusters connected to the slice workspace.
The current version only supports AWS and Akamai cloud clusters. You can view cost allocation only for AWS and Akamai cloud clusters.
View the Cost
To view the resource cost:
-
Go to Cost Management on the left sidebar.
-
On the Slices page, select the slice workspace to get the per slice workspace information.
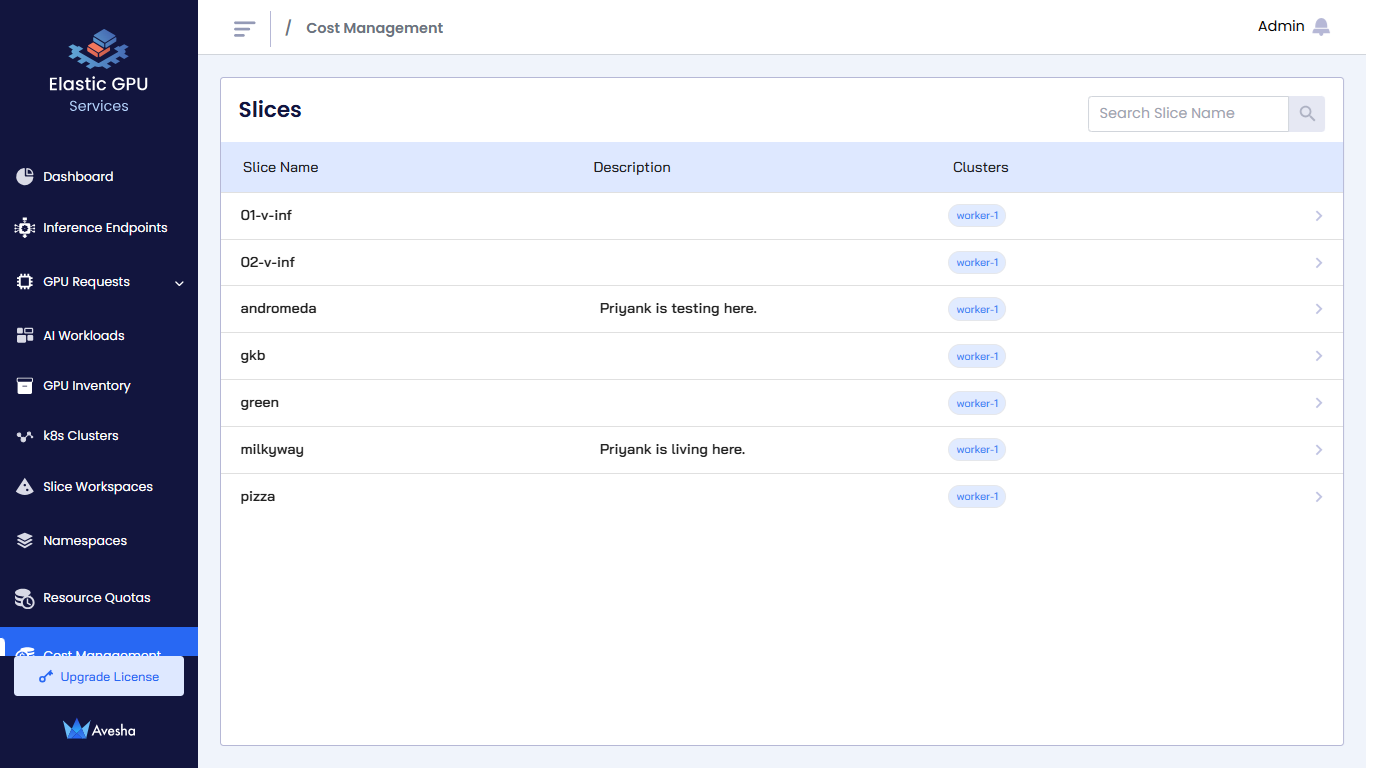
The following figure shows the list of services for each cluster, and the total cost for the tech slice workspace on the top right corner. The default view is
Monthly, which shows the current month cost. Switch toDailyview to see the daily cost details. -
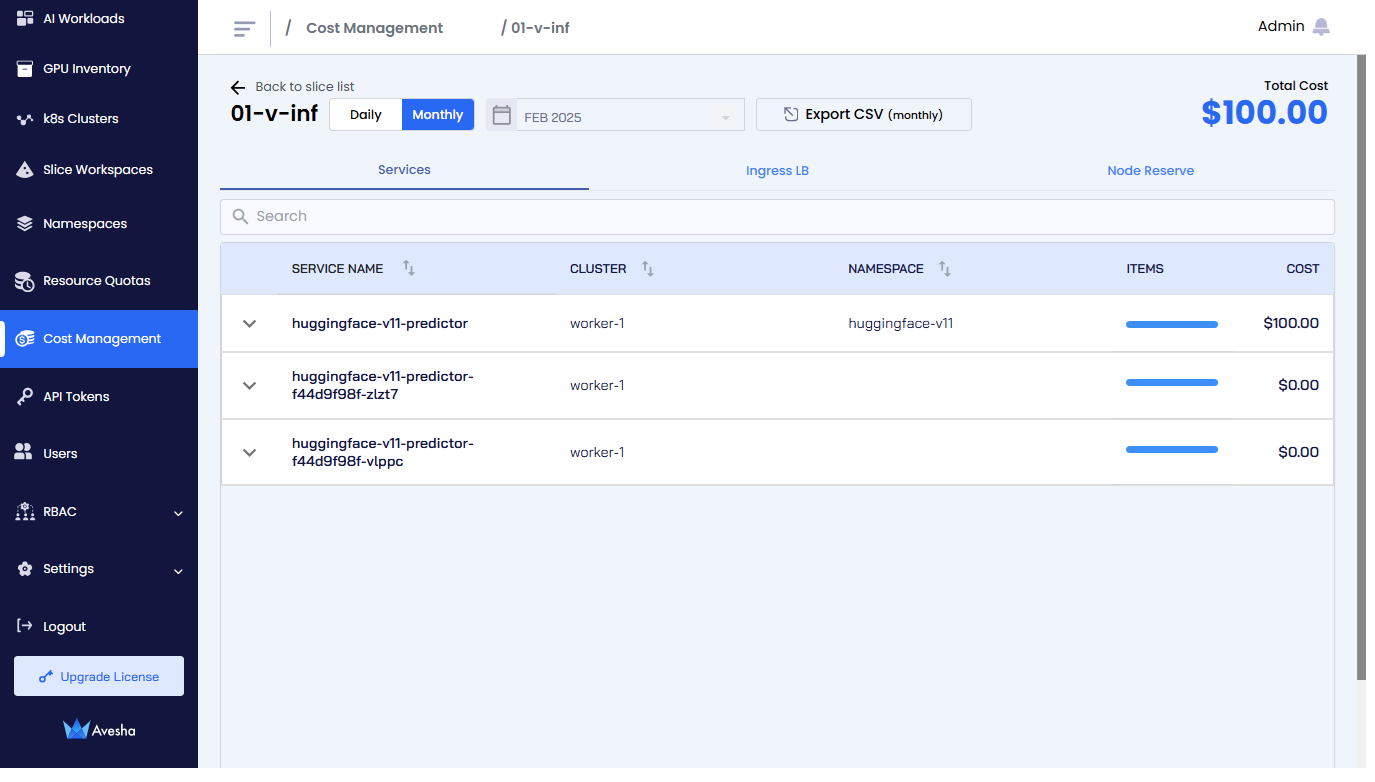
On the selected slice workspace page, you see the Services , Ingress LB, and Node Reserve tabs.
-
On the Services tab, under the SERVICE NAME, view the cost and usage associated with all the services. Select the service to view the cost allocation. For example, for a namespace, view the Usage in millicore hours for compute pods and in GB hours for storage. Additionally, you can see Time in use in hours, and the Price in USD for compute, PersistentVolume, and LoadBalancer items.
-
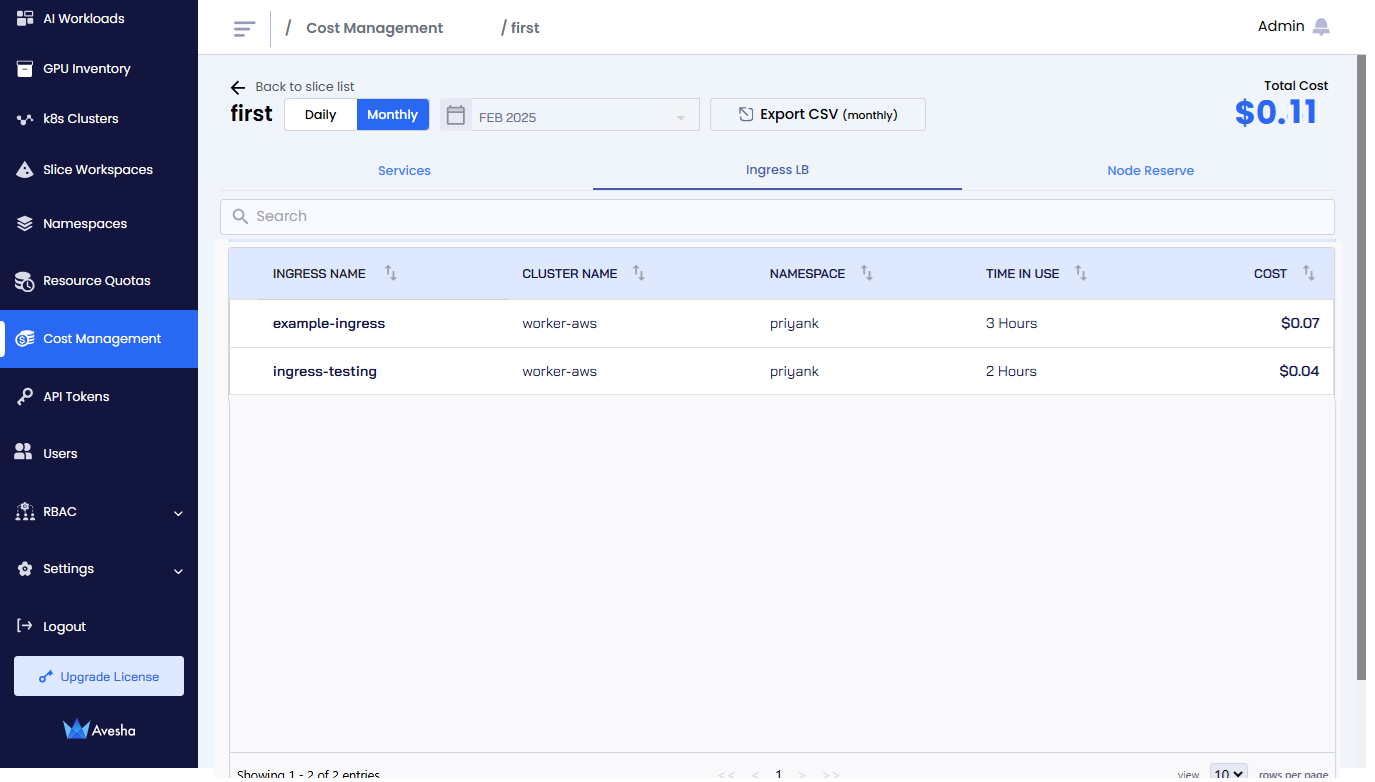
On the Ingress LB tab, under the INGRESS NAME, view the cost associated with the Ingress Load Balancer for a cluster.
-
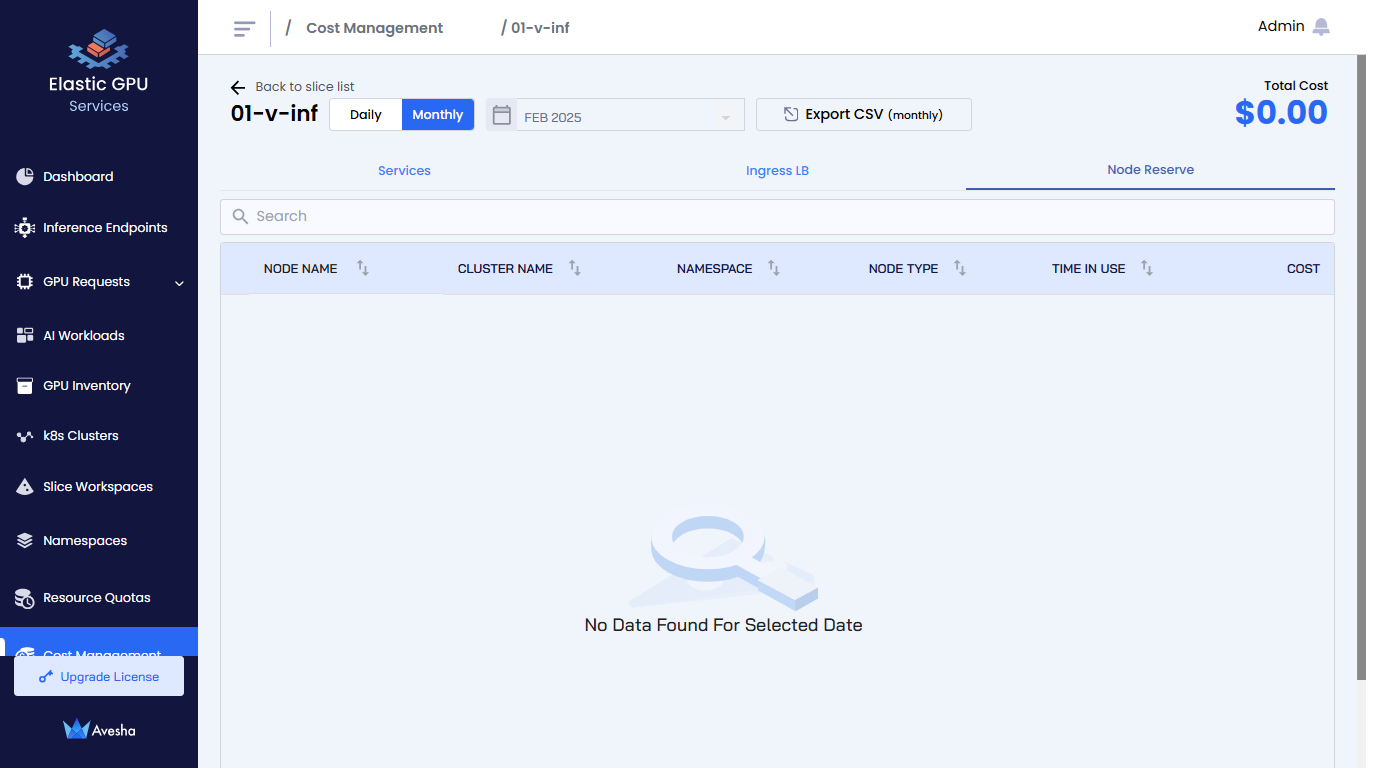
On the Node Reserve tab, under the NODE NAME, view the cost associated with the node resource.
-
Generate the Report
To produce the daily or monthly report per slice workspace in CSV format, select the Daily or Monthly view from the top-left corner, and click the Export CSV button. Save the file to your local system.
The resource cost report per slice workspace includes the following columns:
- start timestamp (UTC): The start of the time range requested by the user.
- end timestamp (UTC): The end of the time range requested by the user.
- slice_name: The slice workspace from which the metrics are generated.
- cluster_name: The cluster from which the metrics are generated.
- name_space: The Kubernetes namespace from which the metrics are generated.
- service_name: The Kubernetes service from which the metrics are generated.
- is_reserved: The value is
TRUEonly for the services listed in the Services tab that are deployed in the reserved node. - millicores_used: The sum of the highest millicore hours usage across the time range requested by the user. For compute pods, millicore hours are represented by usage.
- node_name: The Kubernetes node name from which the metric is generated.
- node_type: The type of node from which the metric is generated. For example, for AWS, it can be
t3.large. - node_cost: The price per hour for the node type from which the metric is generated.
- cost: The total resource cost in US dollars for the requested time range.
- price: This is the price per CPU per hour in US dollars.
Upload the Custom Prices of any Cloud/Cluster Resources
KubeTally provides cost and utilization summaries for resources in arbitrary cloud environments or clusters, such as those on GCP or Azure. The resources' pricing details must be uploaded to KubeTally using an API to generate the report.
The prices API is added in the pricing-service component:
POST api/v1/prices
The API receives payload as a CSV file containing custom pricing information. The following is an example CSV file:
cloud_provider,region,component,type,vcpu,price
gcp,us-east-1,LB,Classic,,1.26
gcp,us-west-1,Compute Instance,t3-xlarge,4,444
linode,ap-west,Compute Instance,g6-nanode-1,1,5.45
linode,ap-west,LB,NodeBalancer,,100
aws,us-east-1,LB,Classic,,200
linode,ap-west,Compute Instance,g6-standard-2,1,1000
aws,us-east-1,Compute Instance,t3.xlarge,2,2000
linode,ap-west,Storage,linode-block-storage,,3000
Descriptions of the CSV File Columns
-
cloud_provider: The cloud service provider. For example,
AWS,GCP, orLinode. -
region: The geographical region in which the service is provided. For example,
us-east-1,ap-west, orus-west-1. -
component: The type of cloud resource or service. For example, Compute, Storage, or LB. The component value must be Compute, LB, or Storage in the CSV file. Otherwise, the prices for that resource will not be listed in the generated reports.
-
type: The specific instance type or service type. The type value must be identical to the one present in the Prometheus utilization metrics. For example,
t3.xlargeorg6-standard-2for compute andlinode-block-storagefor storage.ClassicandNodeBalancerfor LoadBalancer) -
vcpu: The number of virtual CPUs for compute instances. This column is optional and should only be filled for compute entries.
-
price: The price for the service (typically per hour or some other time unit depending on the cloud provider's pricing model).
Currently, the pricing API is not exposed to the end-user. Using the kubectl command, you need to port-forward for the pricing
service component.
To upload by port-forwarding the pricing service component:
-
Prepare the CSV file with custom prices. For example, the file name is
custom_prices.csv. -
Use the following command to find the relevant pod that is running the pricing service:
Example
kubectl -n kubeslice-controller get pods | grep pricing-serviceExample Output
kubetally-pricing-service-57b869fbd5-hxpgf 1/1 Running 0 93m -
Expose pricing-service component using kubectl port-forwarding. Use the following command to port-forward the pod:
kubectl port-forward pod/<pod-name> <local-port>:<container-port> --namespace <namespace>For example, if the pod name is
kubetally-pricing-service-57b869fbd5-hxpgfand the container inside is exposing port 8088, and you want to access it locally on port 8088, the command would be:kubectl port-forward -n kubeslice-controller kubetally-pricing-service-57b869fbd5-hxpgf 8088:8088 -
Upload the CSV file using the API URL in a post call as illustrated in the following example:
curl -X POST -F "file=@custom_prices.csv" http://localhost:8088/api/v1/prices
KubeTally generates the report and displays the utilization summary of resources that you uploaded in the above POST API call. Go to the Cost Management page to see the cost allocation details of these custom resources.